Operations | Monitoring | ITSM | DevOps | Cloud
Monitoring
The latest News and Information on Monitoring for Websites, Applications, APIs, Infrastructure, and other technologies.
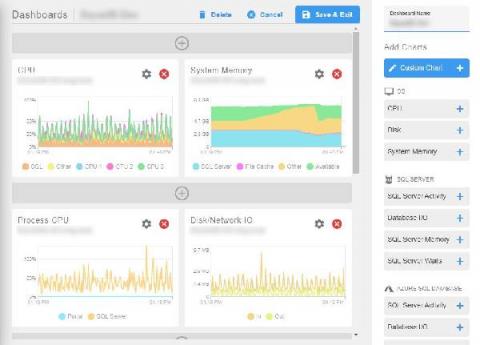
Your Performance Data, Your Way With Custom Charts in SentryOne Portal
New Pandora FMS features and improvements
Today we are here to make a small compilation of the new Pandora FMS features launched throughout this last year 2020, a general review of all the small advances that we incorporated and that will be useful when you are at the controls of our software. Mainly we are going to deal with new features but also great improvements in quality of use that we added to Pandora FMS throughout 2020.
A Day in the Life: Intelligent Observability at Work with an ITOps Hero
This is the second in a series of blog posts exploring the role that intelligent observability plays in the day-to-day life of smart teams. In this post, meet our clever ITOps engineer, James, as he reduces noise and distraction using intelligent observability.
Observability and Monitoring for Modern Applications
I drive a 2005 Ford diesel pickup truck. Most of the time my truck runs great. But occasionally an orange light on the dashboard will flicker on to alert me that something is wrong. Unfortunately, there’s no information about what is wrong and why. My truck has a monitoring solution, but not an observability solution. In many cases, IT has the same problem as my truck.
Observability vs. Monitoring: What's the Difference?
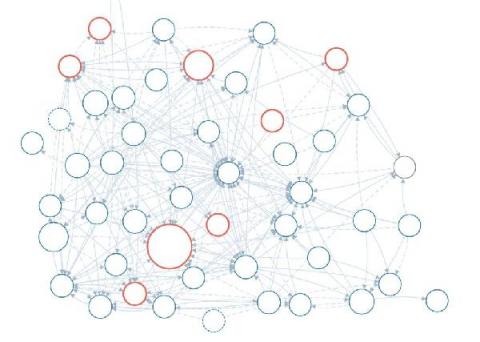
Service Map & Dashboards Provide Insight into Health and Dependencies of Microservice Architecture
Your guide to SSL certificates as an online customer
We’re all familiar with the internet, especially since we use it to do almost all of our daily activities. Since the days of that familiar buzzing noise of AOL dial-up as it connected to somewhere out there in the stratosphere, we’ve been hooked on the internet and its vast space that holds endless amounts of information, ready for us to tap into right at our fingertips.
Centralized Log Management for Cloud Streamlines Root Cause Analysis
Cloud services make the daily tasks of business easier. They enable remote workforce collaboration, streamline administrative tasks, and reduce capital costs. However, these “pros” come with a few “cons.” The IT stack’s increased complexity means staff work across divergent log management tools when something breaks. Centralized log management for the cloud makes root cause analysis easier by aggregating all event log data in a single location.
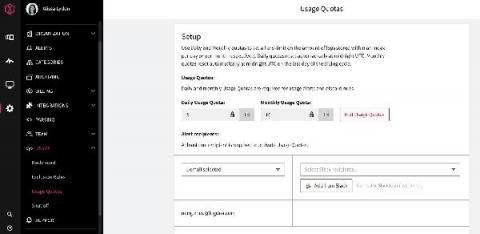
Control Your Logging Spend With Usage Quotas
We built LogDNA around the idea that developers are more productive when they have access to all of the logs they need, when they need them. However, we also know that log management can get expensive fast. And, for anyone who owns the budget for developer tools, logs can be an unpredictable line item as you try to determine your monthly, quarterly or even annual spend.


