Operations | Monitoring | ITSM | DevOps | Cloud

Monitoring

The latest News and Information on Monitoring for Websites, Applications, APIs, Infrastructure, and other technologies.

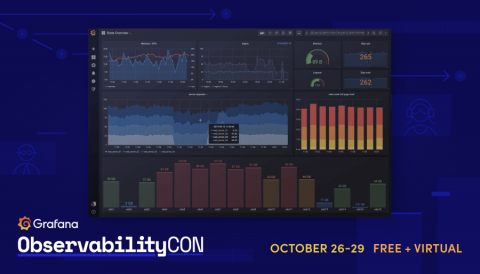
ObservabilityCON Day 2 recap: The latest Grafana Cloud tools for Prometheus to improve alerting, debugging, and scaling. Plus why continuous monitoring matters now

ObservabilityCON 2020 is live! This week Grafana Labs is bringing together the Grafana community for talks dedicated to observability. We hope you’re able to catch the great sessions we have planned. You can find the full schedule on the event page, and for additional information on viewing, participating in Q&As, and more, check out our quick guide to getting the most out of ObservabilityCON. Day 2 was dedicated to all things Prometheus — featuring new solutions and in-depth case studies.

Netdata's dashboard: open by default and secure by design

Let’s talk through a scenario: You have a Linux-based VM running on DigitalOcean (aka a Droplet), and you install Netdata on it using our recommended kickstart script. As the installation process winds down, the Droplet starts up the Netdata Agent’s web server and serves the local Agent web dashboard on port 19999.

Modern Monitoring

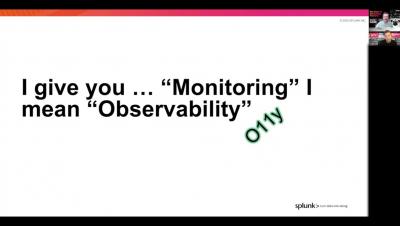
"Observability" - don't roll your eyes just yet. As application architectures change, and the relationship between applications and the infrastructure they run on is blurred, tech-enabled enterprises have to consider new practices for supporting them. Observability gives us an opportunity to embrace the new set of challenges and offer better approaches and strategies. In this episode, we talk about how the complexity of modern apps impacts the changes needed on the management plane.

Top 10 Log Monitoring Reports You Must Have

Log monitoring can be a tedious process. When you have logs, you generate numerous log files in the log database that you need to track. Though a log file parser can help you search through multiple or large logs easily, it’s typically one of those processes which we only look at once it stops working. The windows system logs contain operating system logs as well as logs from applications such as Internet Information Services (IIS) and SQL server.

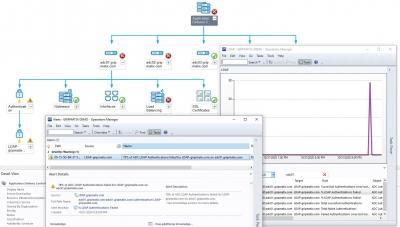
How to automatically map your applications and easily fix server issues

When troubleshooting a SQL Server issue, you don’t need all of those single-use dashboards in the SCOM console. You really only need one interactive diagram to help you identify the root cause in a few clicks – and SquaredUp’s Visual Application Discovery and Analysis (VADA) tool is just that. With this tool, you can also quickly and easily look at all of the servers that make up an application.

New Citrix Application Delivery Controller Management Pack released

We are happy to announce that our new SCOM Management Pack for monitoring Citrix Application Delivery Controller (ADC) instances has been released today! Citrix ADC was previously called 'Netscaler'. With more than 150 monitors and rules, organizations that use Citrix ADC to provide remote access to their employees are now able to insure Remote Work Availability and Performance at all times with SCOM. The MP has become part of our Citrix Ready MetrixInsight for CVAD subscription offering.

Percepio DevAlert - IoT Device Monitoring and Diagnostics (brief summary)

People often have problems with IoT devices due to software issues, and the developers are largely unaware. What if IoT device developers could be notified about real-world issues in IoT devices automatically and get detailed diagnostics on the very first occurrence? This is provided by Percepio DevAlert, a novel cloud service that gives real-world feedback about issues in the device software, that allows for rapid continuous improvement and for embracing DevOps in IoT device development. Learn from real-world usage and make a great product that beats the competition.

Scaling Kubernetes Deployments with InfluxDB & Flux

This article was written by InfluxDB Community member and InfluxAce David McKay. Eighteen hours ago, I was meeting with some colleagues to discuss our Kubernetes initiatives and grand plan for improving the integrations and support for InfluxDB running on Kubernetes. During this meeting, I laid out what I felt was missing for InfluxDB to really shine on Kubernetes.