Operations | Monitoring | ITSM | DevOps | Cloud

Monitoring

The latest News and Information on Monitoring for Websites, Applications, APIs, Infrastructure, and other technologies.

Are your customers catching production problems before you do?

Availability and quality are the biggest differentiators when people opt for a service or product today. You should be aware of the impact of your customers alerting you to your own problems, as well as how to stop this from becoming the norm. To make sure you don’t become an organization known for its bugs, understanding the organizational changes required to deliver a stable service is key.

Expand your Sleuth monitoring reach with Datadog

Sleuth is a deployment tracking tool that gives you a deeper level of insight into your CI/CD workflows by tracking all of your team’s deployment tools from a single dashboard. Sleuth integrates with different components of your deployment pipeline and develops an understanding of your development processes. It can then automatically alert you as to when code is shipping, when manual approvals are needed, and when failures occur.

How to Monitor Amazon SQS with CloudWatch

Amazon SQS is a message queuing service that allows you to send and receive huge numbers of messages from a queue using a simple API. Using Amazon SQS, without setting up any infrastructure, you can have a distributed and fault tolerant queuing system. Since SQS is a managed service, you have less visibility with traditional monitoring tools. As such, it becomes even more important to take advantage of the available monitoring tools in AWS.

Want to Have a Log Management System that is Secure and Yet Efficient?

Across the technology and IT infrastructure domain, log files are recognized as often time-stamped files that can virtually record all critical information about events occurring within the purview of your IT network, OS, or other software applications. Some log files are humanly interpretable, while others are largely meant for machines to consume.

Oracle Functional Monitoring

All databases provide a place to run applications. Monitoring an infrastructure is usually based on its technical components which goes on to extrapolate the health of its applications and programs. However, wouldn’t it be more efficient to monitor the application’s functionality itself? So imagine you have an Order application that consists of a Web UI frontend, Web API backend, business service and an Oracle Database.

Add context to your dashboards from SQL data sources New SQL tile: Line graph

Monitoring information that matters to you will often come from disparate sources – whether you are a server engineer, a SQL database administrator, or an application owner wanting a 360 view of your applications’ health. For example, you may want to visualise your server metrics from SCOM alongside historical trends from the SCOM Data Warehouse.

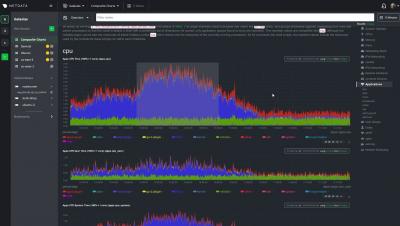
Introducing composite charts and Metric Correlations

We're really excited about supercharging Netdata Cloud's infrastructure monitoring experience with composite charts. These charts look just like the ones you're familiar with, but feature real-time, per-second aggregated metrics from any number of distributed nodes from across your infrastructure. You can still pan, zoom, and highlight to your heart's content while also changing the aggregate function, filtering nodes, or jumping straight into single-node dashboards for root cause analysis.

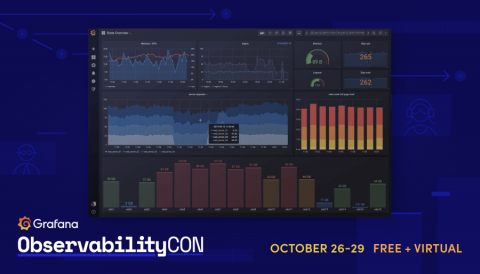
ObservabilityCON Day 4 recap: a panel discussion on observability (and its future), the benefits of Chaos Engineering, and an observability demo showcase

Over the past four days, Grafana Labs' ObservabilityCON 2020 brought together the Grafana community for talks dedicated to observability. We hope you enjoyed all of the sessions, which are available on demand now. (Link to them from the schedule on the event page). The conference wrapped up with predictions and advice from observability experts, lessons in failure, and Grafana Labs team members showcasing ways Grafana and other tools fit into an observability workflow.

How to Monitor & Troubleshoot Clinician Experiences

Learn how Goliath has helped our health system clients reduce barriers to patient care by anticipating performance issues before end-users are even impacted, troubleshooting poor performance quickly when issues do arise, and documenting end-user performance trends to foster collaboration among other IT teams, vendors, management and end-users.