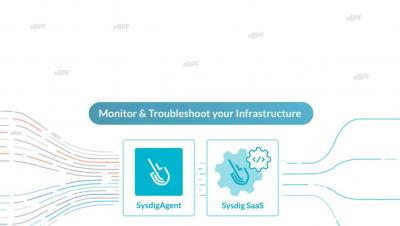
The latest News and Information on Monitoring for Websites, Applications, APIs, Infrastructure, and other technologies.
A trace is the end-to-end journey of one or more connected spans and a span is an operation or “work” taking place on a service. So when it comes to debugging a performance issue, being able to pick out slow spans out of a line up is the fastest way to seeing the root cause and knowing how to solve it. Suspect Spans surfaces a list of spans that correspond to where the most time in a transaction is spent.
SAP delivers a suite of solutions for managing business operations, such as enterprise resource planning (ERP), customer relationship management (CRM), and supply chain management. Many of these solutions, including SAP S/4HANA, run on top of the SAP NetWeaver application development and integration platform. Enterprises and SAP managed providers often operate hundreds or even thousands of SAP NetWeaver systems, and Agentil provides a centralized, low-overhead way to monitor their entire fleet.
Every second counts when IT teams are called upon to resolve business impacting issues. In modern enterprises, poor communication, fragmented toolchains and spiralling IT complexity can conspire to slow down incident response, putting service availability and ultimately customer satisfaction in peril.
You’d be right to think that Tesla’s technology surely wouldn’t go wrong, especially with the huge amounts of media coverage it gets. But in 2021, Tesla suffered a few awkward technological faults. You may have read that Tesla went offline which lead to customers around the world reporting issues around gaining access to their cars.
When an SCCM update failed, this organization found a creative workaround to install MS Teams on 1,200 devices in 48 hours. While every employee is more reliant on their digital experience in remote and hybrid workplaces, the future of work has brought about an increasing number of communication and support challenges for EUC teams. This gap is only exacerbated by the growing pressure on IT teams to deliver unmatched digital employee experience in the ongoing effort to retain talent.
PromQL is the dedicated query language for the metrics and monitoring Stack known as Prometheus. PromQL is well know for having a steep learning curve. Because of this we've created a helpful cheat sheet as a reference to help you with understanding the most common PromQL queries. Please feel free to save the sheet below and share it with any team members that you think would appreciate learning some of the most important queries of PromQL.