Operations | Monitoring | ITSM | DevOps | Cloud
Monitoring
The latest News and Information on Monitoring for Websites, Applications, APIs, Infrastructure, and other technologies.
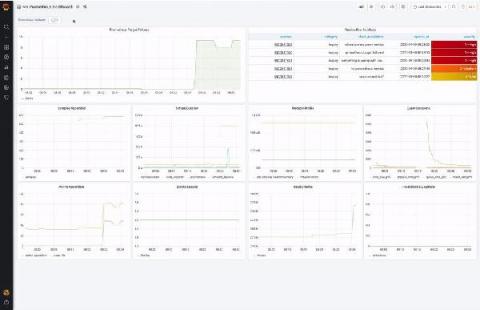
New features in the ServiceNow plugin for Grafana: table query, annotations, and more!
Greetings! This is Eldin reporting from the Solutions Engineering team at Grafana Labs. In previous posts, you might have read about announcing ObservabilityCON or our release of Grafana 7.2. In this week’s post, I am introducing Dave Frankel, who will be covering our updated ServiceNow plugin. – Eldin In a previous post we announced the release of our Enterprise ServiceNow plugin. Our first release was focused around incident and change management based on the feedback we received.
Understand production performance with Cloud Profiler history view
Cloud Profiler is a favorite of Google Cloud customers thanks to the insight that it provides into the performance of your production code. You can use this knowledge to reduce and shorten outages, improve performance, and optimize compute spend—always a popular topic! Profiler has always provided the ability to view and compare CPU and memory performance over time through time filters and the comparison feature.
The 7 Application Performance Metrics You Need to Measure and Why
When it comes to releasing new features out into the wild, developers and managers alike need to toe the line between speed and performance. Take an all too common situation, where sales submits a high priority ticket to the development team that's a blocker for an enterprise deal coming through the pipeline.
Kibana Lens Tutorial: Easily Create Stunning Visualizations
Millions of people already use Kibana for a wide range of purposes, but it was still a challenge for the average business user to quickly learn. Visualizations often require quite a bit of experimentation and several iterations to get the results “just right” and this Kibana Lens tutorial will get you started quickly.


