Operations | Monitoring | ITSM | DevOps | Cloud
Monitoring
The latest News and Information on Monitoring for Websites, Applications, APIs, Infrastructure, and other technologies.
Integrating Flowmon and PRTG guarantees IT performance and maximises security
How to ensure a seamless end-user experience: The ITOM Podcast [Episode 6]
The ITOM Podcast is back with an all new episode aimed to alleviate all your remote work woes in your IT environment. In the last episode, we discussed in detail about the need for compliance checks, major causes of compliance violations across industries, and the solution to help maintain network compliance. This week, we’ll dive into the end-user experience in this era of remote work.
We've grown up a little, got a bit smarter & we're looking sharp!
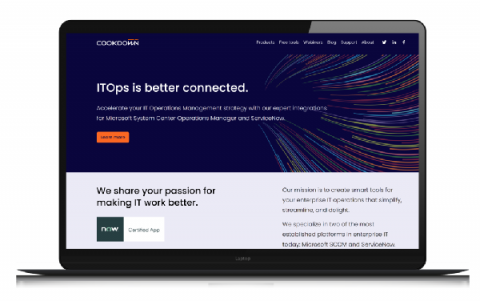
We’re well over a year old now, the team has doubled in size and things are going just swell here at Team_Cookdown. Since we launched, we’ve expanded our product range to include some awesome new solutions like Alert Sync and Discovery and added loads of new features to our existing SCOM toolkit; to bring you expertly crafted integrations solutions for two of the most established platforms in IT enterprise, SCOM and ServiceNow.
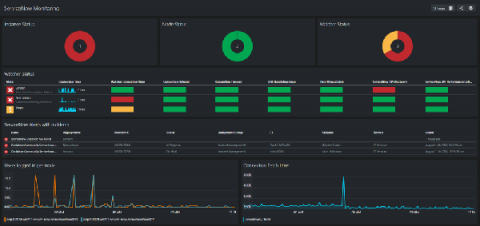
Unlock your ServiceNow Monitoring with Dashboards
Good news! We’ve created an awesome SquaredUp dashboard pack for our ServiceNow Monitoring MP! You can now enjoy our ServiceNow Monitoring MP and Dashboard pack for free, just click on the links below.
Is your team spending too much time on log maintenance?
Log maintenance has a hidden cost. Engineers optimize their instance types, storage, networking, dependencies, and much more. However, we rarely consider the engineers themselves. A DevOps culture encourages engineers to own the solutions they build. While this increases team autonomy, it risks splitting the precious bandwidth that the team has. Automation is what makes the DevOps cycle work, and it has to cover log analysis to do a thorough job of catching issues.
Logging Cost: Are you paying the same for all of your logs?
Fundamentally, there are logs that will be of intrinsic value to you, and others that are less business-critical. Are you aware of the logging cost to handle, analyze and store these different types of logs? Should you really have the same approach for mission-critical logs as you do for info or telemetry logs? Differentiating your approach for different logs is challenging. If no two logs are truly the same then why should you treat them the same?
Has your ELK Stack become too unwieldy to manage?
The ELK stack has become a staple of log analytics in recent years, but so too have the stories of complex maintenance and poor scalability. We’re going to discuss some of the problems with a self-hosted ELK stack and the advantages of a SaaS offering like Coralogix.
Introducing Grafana Metrics Enterprise, a Prometheus-as-a-service solution for enterprise scale
Today, we announced the launch of a new Grafana Labs product: Grafana Metrics Enterprise, a scalable Prometheus-compatible service designed for large organizations that is seamless to use and simple to maintain. Over the past few years, Prometheus has risen in popularity to become the de facto monitoring system for the cloud native ecosystem around Kubernetes — and for good reason.
Tips and tricks for using new RegEx support in Cloud Logging
One of the most frequent questions customers ask is “how do I find this in my logs?”—often followed by a request to use regular expressions in addition to our logging query language. We’re delighted to announce that we recently added support for regular expressions to our query language — now you can search through your logs using the same powerful language selectors as you use in your tooling and software!


