Operations | Monitoring | ITSM | DevOps | Cloud

Monitoring

The latest News and Information on Monitoring for Websites, Applications, APIs, Infrastructure, and other technologies.

Assure Performance of Applications Using Scale-out Storage

The promise of a scale-out storage system (block or file) is that application performance (IOPs or bandwidth) scales “near” linearly. For instance, IOPs and throughout scale almost linearly as you add nodes in a Dell EMC Isilon cluster while latency remains around 1 msec. Isilon is the Dell EMC scale-out NAS storage platform and an ideal system for bandwidth intensive workloads requiring access to unstructured data. As your dataset grows the ability to scale linearly becomes critical.

Virtana to Showcase AI-Powered Hybrid Infrastructure Management Solutions at Gartner IT Infrastructure, Operations & Cloud Strategies Conferences in London and Las Vegas

Virtana, the leader in hybrid infrastructure management for mission-critical workloads, announced today its participation at both the UK edition of Gartner’s IT Infrastructure, Operations & Cloud Strategies Conference, taking place November 25-26, 2019 in London, and the US edition taking place December 9-12, 2019 in Las Vegas.

Here's How to Calculate Elapsed Time in Java

Many things in programming sound like they should be easy, but are quite hard. Calculating elapsed time in Java is one of those. How hard could that be? As it turns out, it can be tricky. For starters, we have the fact that time itself is a tricky concept. For a quick example, remember that many places around the world observe Daylight Savings Time. Failing to take DST into account when you should, can and often does result in incorrect calculations.

Make your monitors nearly real-time

Most of existing IPHost monitor types are passive, meaning they are being polled by IPHost – directly, or via remote network agent. There are two “active” monitors, that perform “Event” type alert, when receiving data from remote host: Syslog monitor and SNMP Generic Trap monitor. Although it’s not possible to transform all possible passive monitors to active, there are several approaches to make monitoring nearly real-time in certain situations.

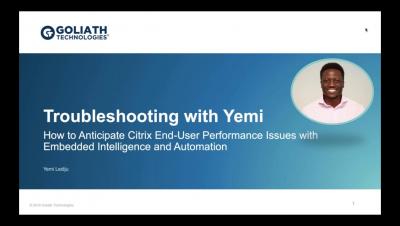
How to Anticipate Citrix End-User Performance Issues with Embedded Intelligence and Automation

Learn how to capture true end-to-end visibility into the health of your complete Citrix infrastructure showing automatically all the dependencies of the underlying elements that can impact end-user performance.

5 Ways to Get Your Company to Buy Grafana Enterprise

In my role at Grafana Labs, I speak with a lot of engineers who feel the pain of their organizations’ lack of consolidated observability – so much so they set out to solve the problem themselves. Often, that search leads to Grafana, and after a quick exploration of what an enterprise feature or cloud solution can provide, they’ll get in touch. We work with them on data collection and help them start a trial.