Operations | Monitoring | ITSM | DevOps | Cloud

Monitoring

The latest News and Information on Monitoring for Websites, Applications, APIs, Infrastructure, and other technologies.

Monitoring Kafka in Production

Franz Kafka was a German-speaking Bohemian Jewish novelist and short story writer, widely regarded as one of the major figures of 20th-century literature. Apache Kafka, on the other hand, is an open-source stream-processing software platform. Due to its widespread integration into enterprise-level infrastructures, monitoring Kafka performance at scale has become an increasingly important issue.

Icinga 2 DSL Feature: Namespaces coming in v2.10

Under the hood, Icinga 2 uses many constants and reserved keywords, e.g. “Critical” or “Zone” which are respected by the config parser and compiler. This sometimes leads to errors when users accidentally override such things, or re-define their own global constants. v2.10 introduces namespaces for this purpose, and ensures that such accidents won’t happen anymore.

The strange case of SNMP: A weird story about protocols

A crime had taken place in Manhattan Grow, a well-established company, so to speak, of invoices. Someone shouted “OH MY GOD, WE MUST FIND THE GUILTY ONE! There wasn’t enough coffee and doughnuts in the machine to calm the entire office. In the middle of summer, the sky was slowly walking towards dusk, slowly fading away. No one was going to leave Manhattan Grow until the mess was fixed. Heads were going to roll.

Get started with server monitoring using Servitor.io

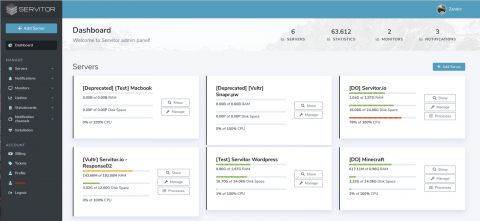
This guide will get you started with Servitor.io, how to setup your monitoring for your server. Since you are reading this I’m going to assume you made an account and are ready to rock! If you, click here to register one and continue. After registering you will be redirected to the dashboard.

6 Reasons to Start Monitoring the Performance of Your Applications

It’s no use computerize your entire company and introducing a poor, slow, or difficult usability system. To effectively anticipate this type of scenario and avoid jobs and headaches for your team, APM – Application Performance Monitoring – comes as a good alternative. Through it, you can analyze how your team is using enterprise applications. With this, you can better understand whether these applications are offering problems or solutions. But the advantages do not stop there.

How To Ensure Good End User Experience With Proactive Monitoring and Troubleshooting

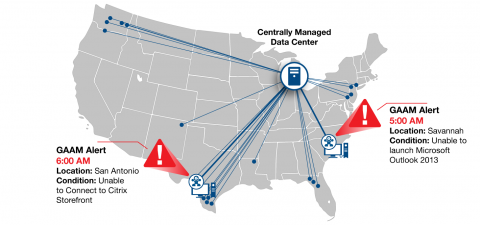
As an IT pro, making sure that the end users have a good experience is one of the most important parts of the job. It’s so important in fact, that there are numerous tools available for monitoring the performance of end user sessions. In most cases, such monitoring tools work by examining a series of performance counters in an effort to quantify the end user experience. In reality, however, performance data and what the end users actually experience can be two very different things.

New: Executive Insights Report

One of the features we love about RapidSpike is the sheer amount of data we collect about the performance of our customers’ websites. We are able to use this data to provide great insight into real user experiences and, crucially, how to improve those experiences. However not everyone has time to analyse that data, or knows exactly what to look for.