Operations | Monitoring | ITSM | DevOps | Cloud
Observability
The latest News and Information on Observabilty for complex systems and related technologies.
SolarWinds Observability: Helping to Accelerate Application Development
Best Practices for Enriching Network Telemetry to Support Network Observability
Network observability is critical. You need the ability to answer any question about your network—across clouds, on-prem, edge locations, and user devices—quickly and easily. But network observability is not always easy. To be successful, you need to collect network telemetry, and that telemetry needs to be extensive and diverse. And once you have that raw telemetry data, you need to interpret it.
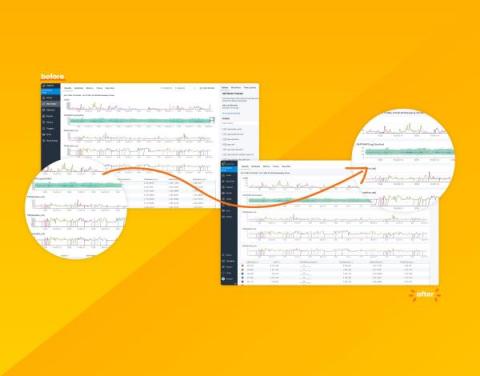
Your Data Just Got a Facelift: Introducing Honeycomb's Data Visualization Updates
Data visualizations take complex information and present it in a clean and easy-to-understand visual. Done right, they can allow quick insight through easy pattern and outlier recognition. Done wrong, it can confuse, obfuscate, and lead to wrong conclusions. Yikes! Over the past few months, we've been hard at work modernizing Honeycomb’s data visualizations to address consistency issues, confusing displays, access to settings, and to improve their overall look and feel.
Using AIOps for automation and efficiency in observability and IT operations
Artificial intelligence for IT Operations (or AIOps) has been playing an expanding role in helping SREs, DevOps, and developers effectively navigate the challenges around application and infrastructure complexity, pace of change, and data volume that characterize the operations landscape.
Webinar Recap: How Observability Impacts SRE, Development, and Security Teams
In today’s fast paced and constantly evolving digital landscape, observability has become a critical component of effective software development. Companies are relying more on and using machine and telemetry data to fix customer problems, refine software and applications, and enhance security. However, while more data has empowered teams with more insights, the value derived from that data isn’t keeping pace with this growth. So how can these teams derive more value from telemetry data?
Test Observability with Sumo Logic
The Right Time to Right-Size Your Observability Process
Every client we meet has been using multiple tools to satisfy their observability needs. We rarely find a greenfield opportunity. As their journey progresses, they have pointed out when the time is right to add ChaosSearch into the fold. There isn't just one symptom; it's usually a combination of things, including high log data volume, unpredictable costs, and ineffective results, to name a few. By the time we talk to clients in this state, the pain and frustration are incredibly high. We created a five-minute video to demonstrate how clients find themselves in this predicament.
How to Get Full Kubernetes Observability in Minutes
How is your organization handling Kubernetes observability? What tools are you using to monitor Kubernetes? Is it a time-consuming, manual process to collect, store and visualize your logging, metrics and tracing data? And, what are you actually getting out of all that investment? At Logz.io we’re trying to make this process easier for customers who are serious about Kubernetes observability. We’ve made significant investments in this area for Kubernetes use cases.


