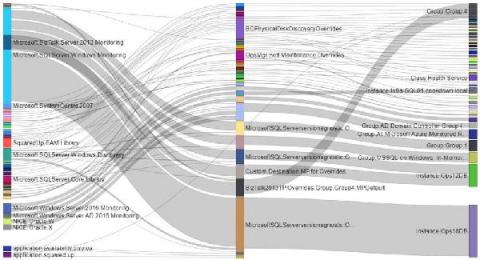
Download PowerBI Diagram for visualizing overrides using Sankey
Did you catch our recent webinar on how PowerBI makes it possible to visualize override sprawl in SCOM with Sankey Diagrams and want to give our Sankey diagrams a go yourself? You are in the right place. Before you dive in, take a look at our blog explaining the “why” to using Sankey PowerBI diagrams to see your overrides, and how to take action based on what you see here.


