Operations | Monitoring | ITSM | DevOps | Cloud
SRE
The latest News and Information on Service Reliability Engineering and related technologies.
SRE vs. DevOps [Understanding Differences & Similarities]
Make your Onboarding Experience Better with a Murder Mystery Game
SRE Availability Metrics
How available is your website, service, or platform? What must you monitor and measure to ensure availability? How do you translate uptime into availability? This chart has numbers that every Site Reliability Engineer (SRE) should know. Below the chart, you will find answers to commonly asked questions about SRE and associated metrics.
A Day in the Life: Intelligent Observability at Work with our SRE, Dinesh
When I asked Charlie for permission to attend this year’s AICon (virtual, natch) I thought it would be a shoo-in; learning’s part of my OKRs after all. But he never makes things easy and his ‘yes’ came with a caveat that’s typical when dealing with him. This time, he claimed he didn’t have the budget for the ticket (a likely story!) and I’d have to find another way to get one.
Practical Guide to SRE: Using SLOs to Increase Reliability
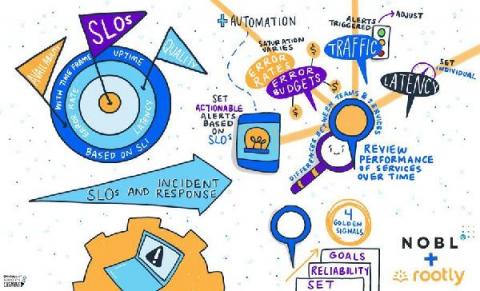
Service Level Objectives (SLOs) are a key component of any successful Site Reliability Engineering initiative. The question is, what are SLOs; and how do you determine what your SLOs should be? Once you've done that, how should you use them?
SRE Leaders Panel: Business Agility is what matters, SRE can help you get there
SRE fundamentals 2021: SLIs vs. SLAs. vs SLOs
A big part of ensuring the availability of your applications is establishing and monitoring service-level metrics—something that our Site Reliability Engineering (SRE) team does every day here at Google Cloud. The end goal of our SRE principles is to improve services and in turn the user experience. The concept of SRE starts with the idea that metrics should be closely tied to business objectives. In addition to business-level SLAs, we also use SLOs and SLIs in SRE planning and practice.
Practical Guide to SRE: Automating On-Call
Let's all face it, on call work isn't fun. But it can be better. Even if you have to work on call, it would be nice to have at least some of the work done for you, before you drag yourself out of bed at 3am to respond to an incident.


