The sun has officially set on KubeCon North America 2023, but the CNCF's flagship event has left a lasting impression on us. Roughly 9,000 Kubernetes enthusiasts descended on Chicago's McCormick Place West to see the K8s community's latest innovations. DevOps professionals, engineers, and architects alike were eager to share and boost their K8s knowledge. Overall, HAProxy joined over 250 other sponsor organizations to celebrate open-source, cloud-native technologies over four activity-packed days.
Wow, can you believe it’s been a year since we announced Cribl Search and redefined the search process for observability and security data? Even though the product is just wrapping up its first year, Cribl Search has achieved unrivaled growth in both user adoption and expansion of product capabilities. Why?
During the opening keynote of ObservabilityCON 2023 in London, we announced a range of new updates to make it easier and faster for the open source observability community to get started and scale their observability stacks.
As more organizations adopt observability at massive scale, they have also been grappling with rising costs. Over the past 12 months, we have been working on different solutions to help our users better understand and manage their observability stack, not to mention the bills that come with scaling it.
Just two months after introducing the public preview of Grafana Beyla, we are excited to announce the general availability of the open source project with the release of Grafana Beyla 1.0 at ObservabilityCON 2023 today. We’ve worked hard in the last two months to stabilize, stress test, and refine the features that were part of the public preview of this open source eBPF auto-instrumentation tool.
At Grafana Labs, our mission has always been to help our users and customers understand the behavior of their applications and services. Over the past two years, the biggest needs we’ve heard from our customers have been to make it easier to understand their observability data, to extend observability into the application layer, and to get deeper, contextualized analytics.
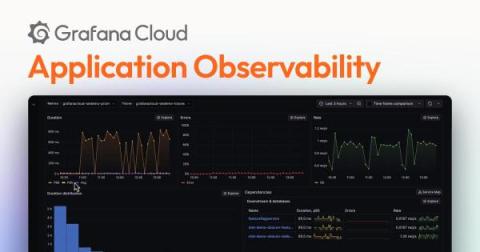
The Grafana LGTM Stack (Loki for logs, Grafana for visualization, Tempo for traces, and Mimir for metrics) offers the freedom and flexibility for monitoring application performance. But we’ve also heard from many of our users and customers that you need a solution that makes it easier and faster to get started with application monitoring.
Today, most organizations rely on several different secure communication mediums — like email, real-time chat, video calls, and SMS — to transmit information, collaborate, and keep teams aligned. While modern communication tools help teams stay connected, the digital landscape is not without its challenges. For most organizations, it’s only a matter of time before network disruptions, security breaches, and system failures impact main lines of communication.