Operations | Monitoring | ITSM | DevOps | Cloud

%term

Simple/hard metrics that help reduce MTTR when looking for a root cause

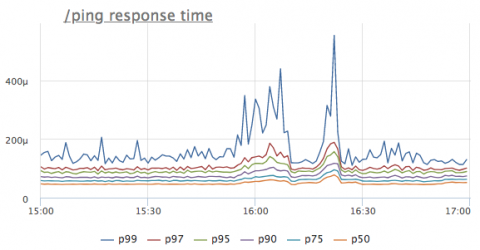
Recently there was a mini-incident in a data center where we host our servers. It did not affect our service after all. And thanks to the right operational metrics, we’ve been able to instantly figure our what’s happening. But then an thought came up to me, how we would’ve been racking our heads trying to understand what’s happening without 2 simple metrics.

5 Server Monitoring Tools you should check out

You work on your software’s performance. But let’s face it: production is where the rubber meets the road. If your application is slow or it fails, then nothing else matters. Are you monitoring your applications in production? Do you see errors and performance problems as they happen? Or do you only see them after users complain? Worse yet, do you never hear about them? What tools do you have in place for tracking performance issues? Can you follow them back to their source?

Simplifying security auditing, Part 2: Auditing systems that store sensitive data

In part 1, we looked at an overview of auditing servers. In this blog, we’ll discuss which events you need to audit in your databases and file servers where sensitive data is stored. New data protection regulations and large-scale global attacks have made this more important than ever before. The main goal is to not only ensure that the accesses and modifications to sensitive data in your network are authorized, but also that file and column integrity are maintained.

Introducing Uptime.com's New UI

We want to begin this post by thanking our long-time Uptime.com members for bearing with us through the transition to our new user interface. You have no doubt noticed the changes. The adjustments to the UI are small, but some important features are now in a different place. Our intent was a more intuitive design. Today, we’ll walk you through some of our most important decisions in this post. First, we’ll document some changes to be aware of.

PM2

The PM2 toolsuite allows developers, SMB and Enterprises to adopt Node.js confidently. With Over 50 million downloads, PM2 Runtime is today the most used production process manager for Node.js.

AppBeat

Our highly available monitoring system periodically checks your online services and sends you immediate notification when a problem is detected. Catch issues before they become incidents!

StatusCast

StatusCast provides a unified communications cloud based platform that allows IT to easily communicate up-time status and scheduled maintenance messages to its end-users with a powerful application status page.

Ship Code Smarter with Monitoring & Feedback

Ahoy there. Continuous shipping: a concept many companies talk about but never get around to implementing. The first post of this three-part series discussed the importance of continuous shipping, while Part 2 steered us into the depths of the process itself. We’re all hands on deck for part three, where we’ll wrap up the second half of the continuous shipping process.

Auto-remediate your IT incidents using scripts

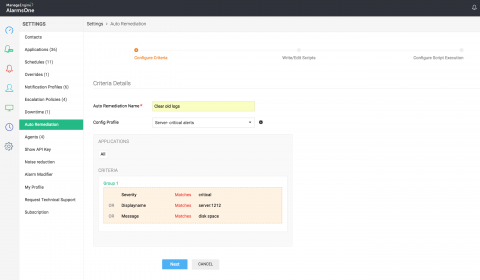
It’s 2am. You receive a notification from your monitoring tool. A host server ran out of space and your system is down. Now you need to get out of bed and clear the log files of whatever service has filled up your available disk space. Ugh. Now, imagine that an automated action is triggered, the log files are cleared, and your system is up and running again without requiring a single thing from you. Sounds cool, right?