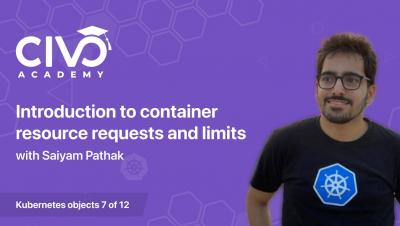
Understanding Container Resource Requests and Limits - Civo Academy
Discover how container resource requests and limits work and what we can do to maintain them.


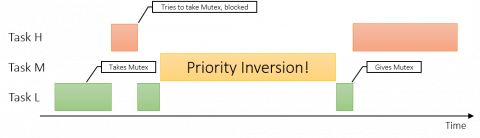
The use of a Real-Time Operating System (RTOS) is increasingly common in embedded software designs. An RTOS makes it easy to divide your code into smaller blocks, tasks, which execute seemingly in parallel and independent of each other, as described in the first article in the RTOS 101 series.
A full-stack networking platform with machine learning, autonomous capabilities, and multicloud support allows devops engineers to focus on what matters most—building applications. The promise of digital transformation is enabling businesses to magnify competitive advantages, create new revenue streams, and improve customer experiences.
Systems and applications alike have become progressively distributed as microservices, open-source tools, and containerisation have gained traction. In order to actively monitor and respond quickly to issues that arise in our environment, distributed tracing has proven to be vital for businesses such as Uber, Postmates, Hello Fresh and TransferWise. It is, however, important to clarify what distributed tracing actually means.
Today’s blog post will give an insight into one of the many things that improved with Icinga DB: how host and service history is written to the database, both by the old IDO feature, as well as what has changed with Icinga DB and how this leads to more reliable results.
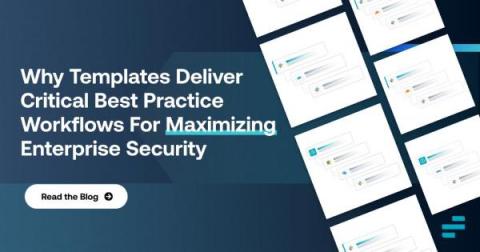
It’s difficult for even the most advanced security teams to stay on top of evolving incursions and ensure their processes effectively map to prevent them. That’s where pre-built templates come into the conversation. No-code, security automation templates can handle the considerable burden of having to maintain and update processes that integrate with a company’s security stack.
Today’s employees enter the workplace with a new expectation: they expect to use the technology they want to use. But can IT really manage a workplace where you can bring your own stack? Ten years ago, the concept of employee experience conjured images of well-decorated, comfortable offices, with ping pong tables and beer on tap. It’s a construct of employee engagement that now feels almost painfully out of touch.