Operations | Monitoring | ITSM | DevOps | Cloud

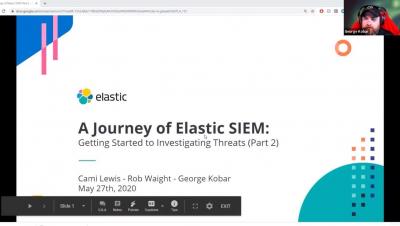
Journey of Elastic SIEM Getting Started to Investigating Threats: Part 2

Calling all security enthusiasts! Many of us are now facing similar challenges working from home. Introduced in 7.2, Elastic SIEM is a great way to provide security analytics and monitoring capabilities to small businesses and homes with limited time and resources. In this three part meetup series we will take you on a journey from zero to hero - getting started with the Elastic SIEM to beginner threat hunting.

Kelverion

Experts in Cloud, On-Premise and Hybrid automation, Kelverion provide solutions and integrations that remove the manual process tying up IT staff; transforming the productivity, efficiency, and supportability of IT service automation.

How to visualize Prometheus histograms in Grafana

Do you have a Prometheus histogram and have you asked yourself how to visualize that histogram in Grafana? You’re not alone. Here, we will show you how it’s done. This post assumes you already have a basic understanding of Prometheus and Grafana and it will look at Prometheus histograms from the perspective of Grafana 7.0.

Attack of the mutant tags!Or why tag mutability is a real security threat

Tag mutability can introduce multiple functional and security issues. In container land, tags are a volatile reference to a concrete image version in a specific point in time. Tags can change unexpectedly, and at any moment. In this article, we’ll learn how we can prevent them.

Simplify Installation and Maintenance with the Project Calico Operator

Within the Kubernetes ecosystem, the Operator Pattern aims to encode the tasks that human operators perform with installing, maintaining, and upgrading infrastructure. It goes beyond manifests and Helm charts to add additional logic to manage critical services. Starting with the 3.15 release, Project Calico will provide an operator for managing Calico installations on Kubernetes clusters.

Leveraging the Database Performance Analyzer API

The RESTful API for Database Performance Analyzer is an incredible time-saver if you are working in an environment where databases go in and out of production. You can easily hook a pre-existing automation job directly into the RESTful API and you'll be monitoring the database in moments. In this video, we'll show you how to get to the self-documented API and what you need to send a command or two.