Operations | Monitoring | ITSM | DevOps | Cloud

%term

What's New at Kentik, Episode 8

Host Leon Adato takes you through the latest updates and features from Kentik. This month, we dive into monitoring analytics for content distribution networks (CDNs), explore the new Use Case Finder in Kentik's knowledgebase, and learn how to include custom fields in Data Explorer. Plus, Leon shares some light-hearted insights on why August is the perfect time to celebrate with Kentik's... uhh... craft brews? Don't forget to like and subscribe to keep up-to-date on everything new at Kentik!

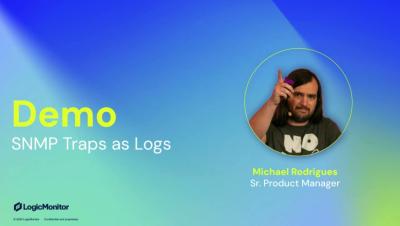
SNMP Traps as Logs | LogicMonitor

In this short demo video, Michael Rodrigues, Senior Product Manager, will give you a tour of SNMP Traps as Logs, a new way to monitor SNMP traps with LogicMonitor. SNMP Traps as Logs enables real-time, event-driven notifications for critical networking issues within a user-friendly interface, unlocking instant insights. By ingesting SNMP traps as logs instead of EventSources, you can consolidate network troubleshooting efforts within a single pane of glass for a holistic Network Monitoring approach, eliminate monitoring gaps, improve reliability, and facilitate resource planning.

Why Full AI-Stack Visibility is Key to High-Performing GPUs and AI Models

The generative AI market is poised to explode. From AI-based co-pilots and assistants to new use cases across healthcare, marketing, sales, software development, and more, generative AI is unleashing a new wave of productivity, efficiency, and transformative employee and customer experiences.

Modernize your Operations Center and Build Operational Resilience with the Latest Features from PagerDuty

Global IT disruptions and outages are becoming the new normal, testing the operational resilience of businesses everywhere. How well prepared your team is to handle major incidents determines how fast the business can return to normal. Operations Centers are relied on to manage these disruptions and ensure quick recovery. They’re the point of entry for incoming data that holds important signals of impending failure that impact customers, the business, and the bottom line.

100G VXC Expansion: Now Available From 597 Data Centers Worldwide

Our 100G connectivity is now one of the most widely available in the NaaS market with new locations across America, Asia Pacific, and Europe. Due to a combination of technological advancements and the forced innovation brought on by COVID-19, businesses are now processing more data than ever. Analytics engines and big compute are being introduced and leveraged across diverse infrastructures. Generative AI is being incorporated wherever businesses can fit it, taking processing capacities to their limits.

LogicMonitor's latest innovations to improve enterprise MTTR, visibility, and control

Enterprise hybrid IT environments are complex beasts, plagued by blind spots, siloed data, and slow incident resolution. Enterprise organizations need a comprehensive solution that provides hybrid observability within a single pane of glass to reduce MTTR/MTTI, eliminate those blind spots, correlate insights across their entire IT infrastructure, and achieve more granular control. LogicMonitor goes beyond basic monitoring to deliver exactly that.

Setup Log Observer Connect in Splunk Observability Cloud

Log Observer Connect will allow you to connect to and view/query logs from your Splunk Enterprise or Splunk Cloud instance from within Splunk Observability Cloud. In this video, I will briefly explain what Log Observer Connect is and then show you how to connect your Splunk Observability Cloud organization to a Splunk Enterprise instance through Log Observer Connect. TOC.