Operations | Monitoring | ITSM | DevOps | Cloud

Black Friday log management (with the Elastic Stack) checklist

For this Black Friday, Sematext wishes you: Now seriously, applications tend to generate a lot more logs on Black Friday, and they also tend to break down more – making those logs even more precious. If you’re using the Elastic Stack for log management, in this post we’ll share some tips and tricks to prepare you for this extra traffic.

Full-Stack Observability Guide

Like cloud-native and DevOps, full-stack observability is one of those software development terms that can sound like an empty buzzword. Look past the jargon, and you’ll find considerable value to be unlocked from building observability into each layer of your software stack. Before we get into the details of observability, let’s take a moment to discuss the context.

Hyperview DCIM 3.6 Software Release

ServiceNow CMDB integration is now available! As well, we continue to roll out enhancements to Firmware Management and 3D view. Now you can view, search and report on the current firmware version for all your assets, both Managed and Unmanaged. In 3D view, you can quickly hone in on a specific set of racks or assets using Focus Mode. Plus, Hyperview now generates a multi-level Heat Map for more nuanced temperature ranges.

Key metrics for monitoring Cilium

Cilium is a Container Network Interface (CNI) for securing and load-balancing network traffic in your Kubernetes environment. As a CNI provider, Cilium extends the orchestrator’s existing network capabilities by giving teams more control over how they build their applications and monitor traffic. For example, vanilla Kubernetes installations typically rely on traditional firewalls and Linux-based network utilities like iptables to filter pod-to-pod traffic by an IP address or port.

Monitor Cilium and Kubernetes performance with Hubble

In Part 1, we looked at some key metrics for monitoring the health and performance of your Cilium-managed Kubernetes clusters and network. In this post, we’ll look at how Hubble enables you to visualize network traffic via a CLI and user interface. But first, we’ll briefly look at Hubble’s underlying infrastructure and how it provides visibility into your environment.

Monitor Cilium-managed infrastructure with Datadog

In Part 2 of this series, we showed how Hubble, Cilium’s observability platform, enables you to view network-level details about service dependencies and traffic flows. Cilium also integrates with various standalone monitoring tools, so you can track the other key metrics discussed in Part 1. But since the platform is an integral part of your infrastructure, you need the ability to easily correlate Cilium network and resource metrics with data from your Kubernetes resources.

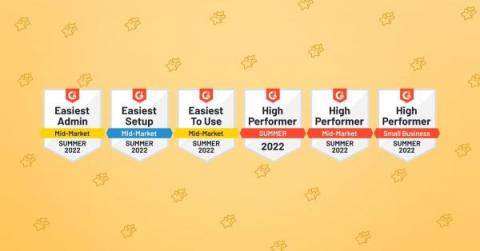
Logz.io Cloud SIEM Honored with 6 Summer 2022 G2 Badges!

For Summer 2022, Logz.io is thrilled to have earned six G2 Research Badges for our Cloud SIEM offering. These honors highlighted the ease of setup, ease of use, and high performance that we provide our customers through Cloud SIEM. G2 Research is a tech marketplace where people can discover, review, and manage the software they need to reach their potential.