Operations | Monitoring | ITSM | DevOps | Cloud

Your Telemetry Data is Faster, Is Your Analysis?

Continuous intelligence (CI) platforms can be used to collect telemetry data from various sources, perform analysis on that data, make inferences about the data, and provide real-time insights that help businesses understand what’s going on. For years, network, application performance, and security monitoring were fairly passive operations. Systems collected key telemetry data, and operators received alerts when a particular metric crossed a preset threshold. Operations were limited in two ways.
Detect user pain points with Datadog Frustration Signals

Whether you run an ecommerce site, a digital publication, or any other customer-facing service, delivering optimum user experiences is key to the success of your business. Customers can grow frustrated and abandon your site when they run into hurdles such as JavaScript errors or confusing page designs, and that frustration negatively impacts your company’s bottom line.

Analyze wait events and in-flight queries with the Datadog Database List

When you’re operating databases at scale, being able to get real-time insights across all your databases is essential for addressing issues and identifying areas for optimization. Datadog Database Monitoring’s Database List allows you to monitor your entire database fleet in one place, so you can quickly identify and troubleshoot overloaded hosts and gauge the impact of problematic queries throughout your infrastructure.

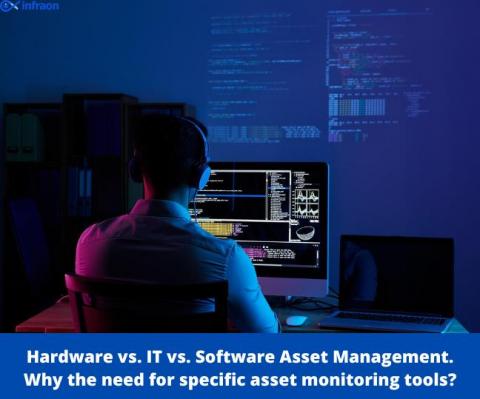
Hardware vs. IT vs. Software Asset Management - Why the need for specific asset monitoring tools?

Hardware asset management (HAM), IT asset management(ITAM), and software asset management (SAM) are all closely related fields that deal with the maintenance of IT assets in an enterprise. Asset management is managing and tracking the lifecycle of all your enterprise’s assets, from physical to digital. They ensure your enterprise has full visibility into its assets to make informed decisions about what it needs to do with them.

Application Snapshots: A Valuable Observability Signal for Developers

Monitoring is often not the first thing on the mind of the modern developer. Yet, it’s necessary at many points of the software development lifecycle, including: before deprecating an API, before launching a new feature, after launching the feature, and more. In fact, monitoring needs can vary much more than the classic Ops monitoring.

gRPC - Monitor gRPC calls with OpenTelemetry | Explained with a Go example

OpenTelemetry can only help in generating the telemetry data. In order to store, and analyze that data, you need to choose a backend analysis tool. In this article, we will monitor collected data from gRPC calls with SigNoz. SigNoz is a full-stack open-source APM tool that provides metrics monitoring and distributed tracing. It is built to natively support OpenTelemetry data formats. Hence, it’s a great choice for a backend analysis tool to combine with OpenTelemetry. On a side note, OpenTelemetry provides you the freedom to select a backend analysis tool of your choice.