Operations | Monitoring | ITSM | DevOps | Cloud
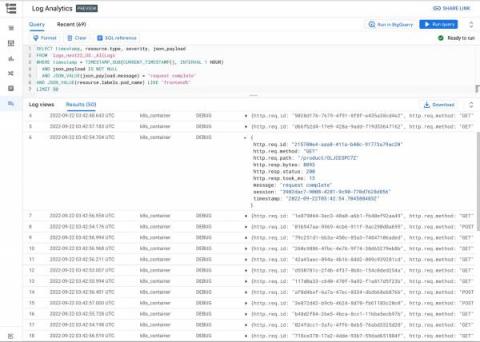
Introducing Cloud Logging - Log Analytics, powered by BigQuery
Logging is a critical part of the software development lifecycle allowing developers to debug their apps, DevOps/SRE teams to troubleshoot issues, and security admins to analyze access. Cloud Logging provides a powerful pipeline to reliably ingest logs at scale and quickly find your logs. Today, we’re pleased to announce Log Analytics, a new set of features in Cloud Logging available in Preview, powered by BigQuery that allows you to gain even more insights and value from your logs.
GitOps your service orchestrations
GitOps takes DevOps best practices used for application development (such as version control and CI/CD) and applies them to infrastructure automation. In GitOps, the Git repository serves as the source of truth and the CD pipeline is responsible for building, testing, and deploying the application code and the underlying infrastructure. Nowadays, an application is not just code running on infrastructure that you own and operate.
Analyze Pacemaker logs in Cloud Logging
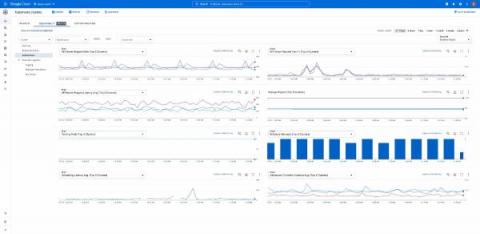
Introducing Kubernetes control plane metrics in GKE
An essential aspect of operating any application is the ability to observe the health and performance of that application and of the underlying infrastructure to quickly resolve issues as they arise. Google Kubernetes Engine (GKE) already provides audit logs, operational logs, and metrics along with out-of-the-box dashboards and automatic error reporting to facilitate running reliable applications at scale.
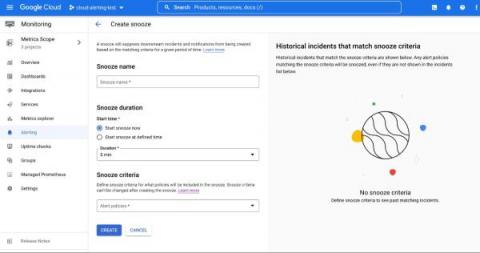
Snooze your alert policies in Cloud Monitoring
Does your development team want to snooze alerts during non-business hours? Or proactively prevent the creation of expected alerts for an upcoming expected maintenance window? Cloud Alerting in Google's Cloud operations suite now supports the ability to snooze alert policies for a given period of time. You can create a Snooze by providing specific alert policies and a time period. During this window, if the alert policy is violated, no incidents or notifications are created.
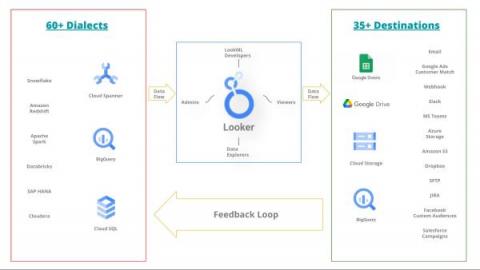
Managing the Looker ecosystem at scale with SRE and DevOps practices
Many organizations struggle to create data-driven cultures where each employee is empowered to make decisions based on data. This is especially true for enterprises with a variety of systems and tools in use across different teams. If you are a leader, manager, or executive focused on how your team can leverage Google's SRE practices or wider DevOps practices, definitely you are in the right place!
Stream application logs into Cloud Logging
More support for structured logs in new version of Go logging library
The new version of the Google logging client library for Go has been released. Version 1.5 adds new features and bug fixes including new structured logging capabilities that complete last year's effort to enrich structured logging support in Google logging client libraries. Here are few of the new features in v1.5: Let's look into each closer.
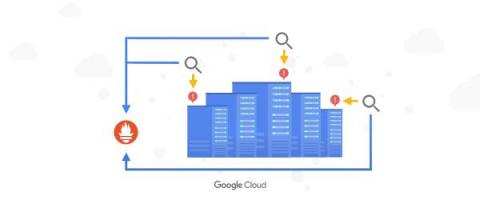
Cloud Monitoring metrics, now in Managed Service for Prometheus
According to a recent CNCF survey, 86% of the cloud native community reports that they use Prometheus for observability. As Prometheus becomes more of a standard, an increasing number of developers are becoming fluent in PromQL, Prometheus’ built-in query language. While it is a powerful, flexible, and expressive query language, PromQL is typically only able to query Prometheus time series data.


