Operations | Monitoring | ITSM | DevOps | Cloud

Dashboards

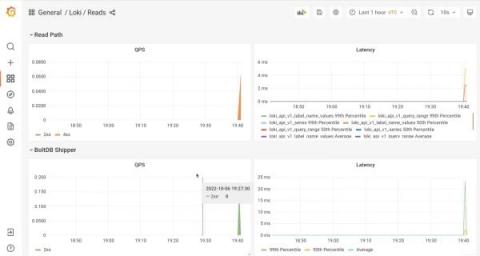
Inside the migration from Consul to memberlist at Grafana Labs

At Grafana Labs we run a lot of distributed databases. These distributed databases all make use of a hash ring in order to evenly distribute workloads across replicas of certain components. For a more detailed description of the architecture of our projects, check out our Mimir architecture docs.

How I monitor cloud application costs in one simple but powerful dashboard

Although there are many great tools out there to get on top of application monitoring, there’s one vital metric that’s often overlooked by us technical folks – cost. In the days of running apps on servers in private datacenters, the kit was a one-time purchase that the systems team had to deal with. But running apps in public clouds is a different story. Whether you’re running on VMs, containers in Kubernetes, or entirely serverless, execution of your code adds to the bill.

How to build machine learning models faster with Grafana

Armin Müller is the co-founder of ScopeSET. ScopeSET specializes in R&D work to build and integrate tools in the model-based systems engineering domain, with a track record of more than 15 years of delivering innovative solutions for ESA and the aerospace industry. Training machine learning models takes a lot of time, so we’re always looking for ways to accelerate the process at ScopeSET. We use open source components to build research and development tools for technical companies.

How to get complete CI/CD pipeline observability

It's not like it used to be back in the day! Before CI/CD, we were building on-premises, service-oriented products following system style architecture and we were able to map out the build system and end-to-end process in a PowerPoint or Visio document. Although time-consuming and inefficient, it was relatively straightforward and the build pipeline was unlikely to change drastically. But that's no longer the case.

Dashboard Studio: It's the Little Things

It's always interesting to hear what feature requests dashboard users share with our product team. Sometimes it's big things — such as being able to set tokens on drilldowns — and sometimes it's little things. In Splunk Cloud Platform 9.0.2208, we've included a handful of Dashboard Studio "little things" updates.

Troubleshoot in less than 60 seconds with Grafana: Inside NOS's observability stack

It may seem like ancient history, but there was a time when telecommunications companies only had to worry about connecting customers over landlines. Today, their businesses depend on vast cellular networks to not only provide strong wireless phone coverage in countless locations, but also handle the demands of tablets, computers, and machine-to-machine communications.

Software Project Managers: get total visibility of all your tools

Project managing global software projects is always a challenge, contending with multiple time zones, tools, and teams. In these environments, the day-to-day life of a Project Manager is filled with status collections, project reporting, and little time for much else. While the detail will always matter – like team bug data, feature status, and build progress – there is a better way than collecting and reporting on all this data manually. Does this scenario sound familiar?

How to convert a mini-arcade machine into a Grafana dashboard display with Raspberry Pi

When COVID-19 hit, Yonatan Mevorach faced an unexpected challenge, which required an unexpected solution. The Infrastructure Team Lead at Wix, the popular website building platform, was accustomed to looking at multiple monitors on the walls of the software company’s offices in Tel Aviv, Israel. These monitors cycled through Grafana dashboards to help the team keep tabs on Wix’s many services.

Grafana alerts as code: Get started with Terraform and Grafana Alerting

Alerting infrastructure is often complex, with many pieces of the pipeline that often live in different places. Scaling this across many teams and organizations is an especially challenging task. As organizations grow in size, the observability component tends to grow along with it. For example, you may have many components, each of which needs a different set of alerts. You may have several teams, each with a different channel where notifications should be delivered.