Operations | Monitoring | ITSM | DevOps | Cloud

Dashboards

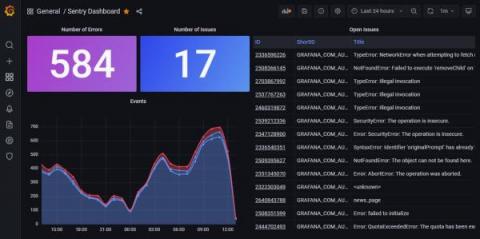
Introducing the Sentry data source plugin for Grafana

We’re thrilled to announce the addition of the Sentry data source plugin to Grafana. Grafana Labs worked in partnership with Sentry, the code observability platform, to help development teams see the issues that matter and solve them faster — across their entire tech stack — so they can remove silos and ship with confidence.

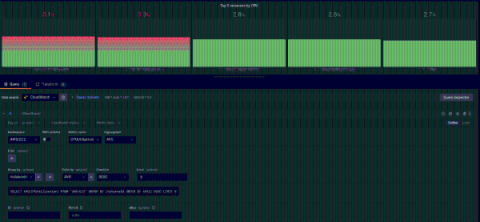
Identify operational issues quickly by using Grafana and Amazon CloudWatch Metrics Insights

Amazon CloudWatch has recently launched Metrics Insights (Preview) — a fast, flexible, SQL-based query engine that enables you to identify trends and patterns across millions of operational metrics in real-time. With Metrics Insights, you can easily query and analyze your metrics to gain better visibility into the health and performance of your infrastructure and large scale applications.

Get Started with the Public Beta for Unified Dashboards

During Logz.io’s ScaleUp 2021 user conference, we announced that Unified Dashboards were coming to you soon. And now it’s finally here for anyone to try during the Public Beta. Unified Dashboards will allow Logz.io customers to analyze and filter their logs, metrics, and traces side-by-side on a single monitoring dashboard. Check out our recent blog to learn about why we built Unified Dashboards and the value they bring to customers.

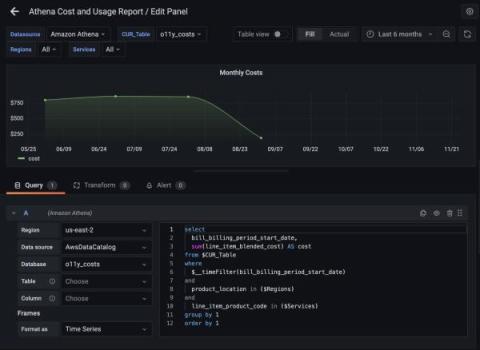
Query and analyze Amazon S3 data with the new Amazon Athena plugin for Grafana

In collaboration with the AWS team, we have recently released the new Athena data source plugin for Grafana. Athena is an interactive serverless service that makes it easy to analyze data in Amazon S3 using standard SQL. Athena supports a wide variety of data formats including CSV, JSON, ORC, Arvo, and Parquet. Athena also integrates with AWS Glue Data Catalog, which allows you to create tables and query data based on a central metadata store of many AWS services, such as CloudFront, ELB, and more.

Enterprise IT Dashboards

Interpreting data and making fast decisions is critical for any leader in today's business world. But how is it done? Everyone remembers the old way of doing things where analysts would manually crunch the numbers and give a final output. This business intelligence would be presented to their boss, and decisions would be made. This batch way of running numbers and presenting them is not sustainable due to the massive amount of manual effort involved to recompile datasets and present them properly.

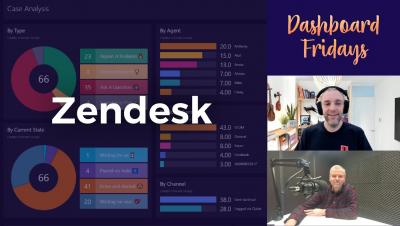
Dashboard Fridays: Sample Zendesk Support Dashboard

Our Support Team wanted a real-time overview of all the cases currently in play so they could monitor multiple channels in one place. This dashboard gives the team a real-time view of their tickets by type, status, topic, and more! Join Adam Kinniburgh and our Customer Support Manager Mike Halfacree as they showcase this sample Zendesk dashboard - how it's made, who it's for, the challenges it solves and how you can easily replicate it!

Unifying VM and microservice monitoring with Kubernetes, Prometheus, and Grafana

According to a 2020 CNCF survey, the use of containers in production has been rapidly increasing for the past several years. Nutanix, a global leader in cloud software and a pioneer in hyperconverged infrastructure solutions, is part of that trend.

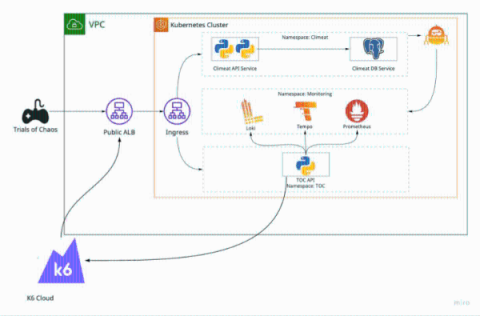
Testing shift left observability with the Grafana Stack, OpenTelemetry, and k6

Development is no longer a linear journey from point A to point B. As more projects shift into a state of organic growth, user feedback and constant experimentation are increasingly becoming the norm, if not the standard for engineering. “In order to support this rapid experimentation, we’re beginning to embrace new working methods and practices,” said Vinodh Ravi, Executive Director of Platform Engineering at JPMorgan Chase.

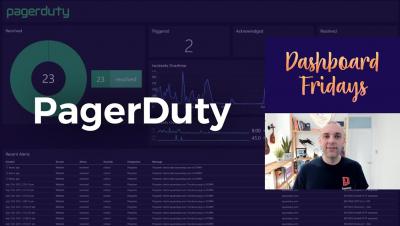
Dashboard Fridays: Sample PagerDuty Alerting dashboard

Adam Kinniburgh is back with another Dashboard Fridays episode, this time joined by Ashley Thompson as they showcase this example PagerDuty Alerting dashboard. This dashboard gives an overview of alerting sent to PagerDuty from any source, even external sources like Pingdom.