Operations | Monitoring | ITSM | DevOps | Cloud

Dashboards

Smarter IT Operations Through Actionable Insight

Business leaders talk excitedly about "digital transformation" and "innovative customer experience," but it falls on the shoulders of IT operations to make sure everything actually works. As transformation takes hold, IT teams manage increasingly complex, hybrid, and distributed environments – often comprising traditional on-premises systems and modern infrastructures made up of containers, multiple clouds, and virtualized networks.

ObservabilityCON 2021: Your guide to the newest announcements from Grafana Labs

This morning during the ObservabilityCON keynote, we announced some of the exciting projects and feature enhancements we’ve been working on for our customers and community. And it doesn’t end there. Throughout the week, we’ll continue to unveil new features, go deeper with live demos, and share our plans to shape the future of observability. With so many new announcements and features to check out, we want to make sure you know where to get more details about these developments.

The 18 most popular data source plugins for Grafana in 2021

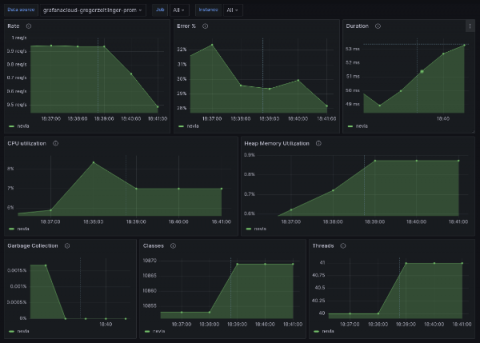
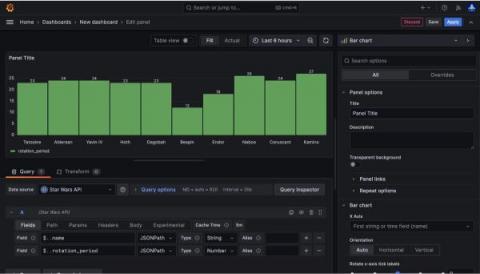
As a composable solution, Grafana allows you to bring your data into dashboards natively without having to extract it, load it, or transform it. We believe in a “big tent” philosophy, which allows you to choose the tools that best suit your observability strategy, and with our plugins, Grafana is interoperable with more than 100 data sources.

Make sense of complex systems with Dynamic Service Graph by PagerDuty

The Dynamic Service Graph breaks down silos between teams and provides organizations with a living, breathing asset that displays technical and business services and their relationships at scale. It allows teams to quickly grasp the state of services, visually digest the full impact radius of an issue, zero in on likely cause, and seamlessly facilitate cross-team collaboration.

Visualize and manage all of your services in one place with Dynamic Service Graph

In this digital era, technology systems are becoming increasingly complex. No longer can a single SME (subject matter expert) understand every facet of the system they run. Instead, much of this knowledge is siloed and exists as tribal knowledge within certain teams. Additionally, the rate of change is faster than ever, with code deploying and new services shipping at a rate unimaginable a few years ago.

Dashboard Fridays: Sample JIRA Health dashboard

Join SquaredUp's Adam Kinniburgh and Tim Wheeler as they showcase this example Jira Health Status dashboard. Offering a quick view of the state of your next release, alongside the health of the Jira project as a whole, this dashboard uses SquaredUp’s Web API and PowerShell tiles to improve on Jira’s native dashboarding capabilities. Tune in to learn how it was made, the challenges it solves, and our top tips for building it yourself.

How sparse histograms can improve efficiency, precision, and mergeability in Prometheus TSDB

Grafana Labs recently hosted its first company-wide hackathon, and we joined forces with Björn “Beorn” Rabenstein to bring sparse high-resolution histograms in Prometheus TSDB into a working prototype. The Prometheus TSDB has gained experimental support to store and retrieve these new sparse high-resolution histograms. At PromCon 2021, we presented our exciting, fresh-off-the-presses results from the ongoing project.

Introducing new integrations to make it easier to monitor Vault with Grafana

HashiCorp Vault is an increasingly popular multi-cloud security tool that allows users to authenticate and access different clouds, systems, and endpoints, and centrally store, access, and deploy secrets. At Grafana Labs, we’re always looking for ways to make it easy for our community to get started monitoring important parts of their systems. So we’re happy to share some new integrations that will help our users get the most out of Grafana + Vault.

Dashboard Studio: New Features Highlighted At .conf21

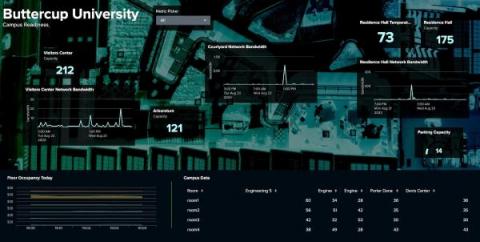
I am very excited that this year’s.conf21was the first.conf where we got to showcase Dashboard Studio, which has come built-in with every Splunk Enterprise and Splunk Cloud Platform release, since 8.2 and 8.1.2103, respectively. I am even more excited to share a packed list of new features in the 8.2.2109 release, which coincides with.conf21! This blog post will highlight a few capability areas we've been heavily focused on that will help you do even more with your dashboards.

Get control back into the Control Room

This article explains how SquaredUp for SCOM leverages the true power of the SCOM platform: the SCOM object model. I believe in dashboarding you need simplicity and granularity all in one. Simplicity for your Control Room, which gives clear and quick insight. Granularity and detail for your system management engineers to be able to drill-down into details and find that Root-Cause quickly.