Operations | Monitoring | ITSM | DevOps | Cloud
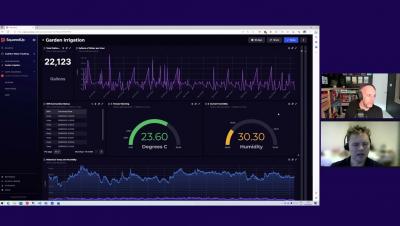
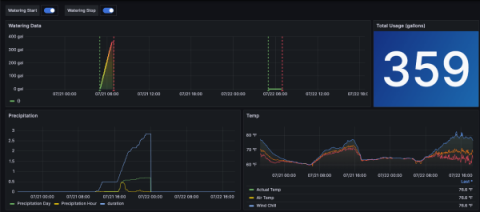
Dashboard Stories: Observing Garden Irrigation water usage with SQL
Dashboards & Reports for New-Age Observability with DX UIM from Broadcom
Less is more: How Grafana Mimir queries run faster and more cost efficiently with fewer indexes
Over the past six months, we have been working on optimizing query performance in Grafana Mimir, the open source TSDB for long-term metrics storage. First, we tackled most of the out-of-memory errors in the Mimir store-gateway component by streaming results, as we discussed in a previous blog post. We also wrote about how we eliminated mmap from the store-gateway and as a result, health check timeouts largely disappeared.
Monitoring machine learning models in production with Grafana and ClearML
Victor Sonck is a Developer Advocate for ClearML, an open source platform for Machine Learning Operations (MLOps). MLOps platforms facilitate the deployment and management of machine learning models in production. As most machine learning engineers can attest, ML model serving in production is hard. But one way to make it easier is to connect your model serving engine with the rest of your MLOps stack, and then use Grafana to monitor model predictions and speed.
Grafana vs. SolarWinds - The Dashboards
Dashboards are great ways to visualize different KPIs in a single place. Metrics from all over your system can be framed together and viewed on a single screen, helping to correlate them and reducing the overall effort of analysis. But when it comes to Grafana vs. SolarWinds, which one is better? It is often difficult to choose between their dashboarding capabilities. Both tools provide their own visualizations and help bring out interactive dashboards for users to use.
Using DX NetOps Dashboards To Harness the Power of AppNeta Data
In today’s dynamic, complex network environments, there’s a big difference between having monitoring data and having intelligence. To troubleshoot issues quickly, it’s vital to have timely, intuitive visibility into the metrics that matter. With the combination of AppNeta and DX NetOps, teams can gain the insights they need to efficiently and intelligently manage their environments.
Reduce MTTR with Grafana, Grafana k6, and Prometheus: Inside DHL's observability stack
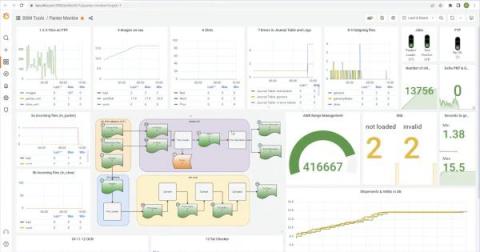
Each year, more than 296 million packages are shipped around the world via DHL and their premium service, Time Definite International. And at DHL Express Switzerland, a local unit of the international logistics and shipping company, the IT team provides solutions for tracking customs clearance progress, analytics, mobile and optical character recognition (OCR) scanning, and warehouse management on every package that moves through Switzerland.
Dashboards, Metrics & Alerts management in SigNoz
How to monitor pool water levels from anywhere with Grafana
I’ve had a swimming pool at my house in Massachusetts since 2016. One of the problems that pool owners like myself face when we go on vacation or leave for several days is evaporation from the pool and the water level dropping below the skimmers. This can happen due to sunlight and warm temperatures. It can also happen when temperatures drop at night and the pool is being heated — the water temperature is warmer than the air, causing the water to evaporate.


