Operations | Monitoring | ITSM | DevOps | Cloud

Dashboards

Uptime and Response Time Graphs

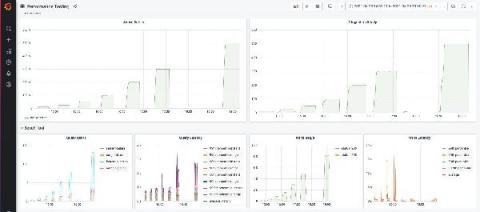
As one of the most requested features we are happy to officially introduce the Uptime and Response time graphs. Setting up an uptime graph requires zero configuration, it’ll be added automatically to your status page (for startup & business subscribers) and you can choose to hide it in the design page of your admin panel.

Introducing Dashboard Widgets

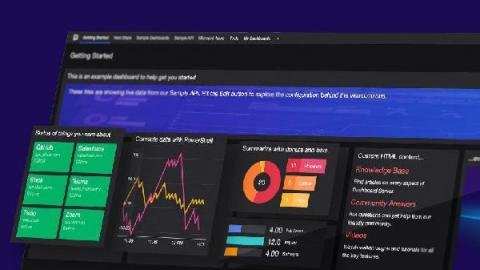
This morning we launched a new update for the RapidSpike App. This update includes a totally new Dashboard experience for our users. Our old dashboard – or “Home” screen – featured a number of fairly static graphs and charts showing your account usage. We felt that this screen was badly in need of an update to show off the cool and exciting facts and figures RapidSpike can generate.

Raygun's Dashboard: Spot performance problems and get data quickly

Raygun’s software intelligence platform brings you a new way to view and sort your data with a new Dashboard. Raygun is designed to give you a better understanding of your overall software health – from errors and crashes to performance problems affecting your end users. To do this, Raygun gathers a great deal of data about how users are interacting with your application and whether it is performing at its best.

GrafanaCon EU 2018: Inherited Technical Debt - A Tale of Overcoming Enterprise Inertia

Amgen has been on a journey to confront the multi-million dollar elephant in the room. Technical debt that had been passed down for 10 years in their monitoring portfolio. But how to overcome inertia and a failure to understand how to maximize internal value for data that belongs to organization to begin with?

GrafanaCon EU 2018: What Does Kubernetes Look Like? Performance Monitoring and Visualization with Grafana

Monitoring Kubernetes is vital to understanding the health and performance of a cluster, but which metrics are most important to add to your dashboards and alert on? Jacob will discuss how to most effectively monitor and visualize your Kubernetes cluster using the Grafana Kubernetes plugin and PromQL.