Operations | Monitoring | ITSM | DevOps | Cloud
Monitor your NVIDIA Jetson IoT devices with Datadog
NVIDIA Jetson is a family of embedded, low-power computing boards designed to support machine learning and AI applications at the edge. Organizations use Jetson boards for complex video and image processing and analysis, automating build processes in factories, and improving city infrastructures. For example, Jetson-based devices enable cities to analyze traffic patterns with their existing traffic cameras in order to find ways to improve their most congested intersections.
Datadog automatically surfaces actionable insights into your Lambda functions
Serverless platforms like AWS Lambda have helped accelerate application development by removing the need to provision and manage infrastructure resources. However, serverless architecture presents new monitoring challenges. Because AWS Lambda handles underlying infrastructure for you, you don’t have access to system-level metrics. Instead, you have to monitor your Lambda functions for insight into their performance and resource usage.
Automated root cause analysis with Watchdog RCA
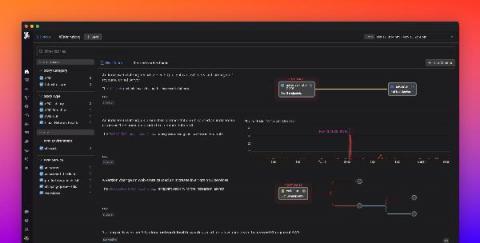
Since 2018, Watchdog has provided automatic, machine learning-based anomaly detection to notify you of performance issues in your applications. Earlier this year, Watchdog started grouping APM anomalies across your services, allowing you to better understand the scope of the issue.
Key Kubernetes audit logs for monitoring cluster security
Kubernetes continues to be a popular platform for deploying containerized applications, but securing Kubernetes environments as you scale up is challenging. Each new container increases your application’s attack surface, or the number of potential entry points for unauthorized access. Without complete visibility into every managed container and application request, you can easily overlook gaps in your application’s security as well as malicious activity.
Best practices for monitoring authentication logs
If you are running a user-facing web application, you likely implement some form of authentication flow to allow users to log in securely. You may even use multiple systems and methods for different purposes or separate groups of users. For example, employees might use OAuth-based authentication managed by a company-provided Google account to log in to internal services while customers can use a username and password system or their own Google credentials.
Share Datadog dashboards securely with anyone outside of your organization
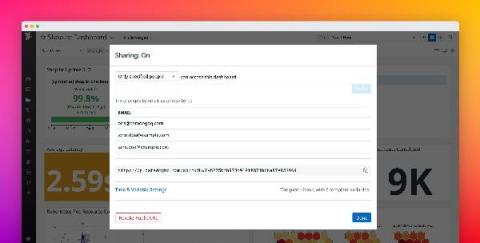
Datadog dashboards provide a unified view of your application, infrastructure, and business data, giving stakeholders the context they need to make decisions. Sharing dashboards publicly is useful when you want to make them easily accessible to a large audience. But oftentimes, your dashboards include sensitive information, which is why you need finer-grained controls over the data you share—and who you share it with.
Send SMS alerts with webhooks and Twilio
When an alert triggers in your application or environment, you want your team to know as soon as possible so you can troubleshoot quickly and minimize any user-facing issues. Datadog can automatically alert you via email and collaboration services like Slack and PagerDuty. The simple, real-time communication provided by SMS can also be an effective way to alert your team.
Monitor applications running on VMware Tanzu Application Service
Cloud Foundry is an open source deployment and orchestration platform that gives developers a readymade workflow for launching applications without configuring the underlying infrastructure. VMware Tanzu Application Service for VMs (TAS) is a commercially available certified platform for Cloud Foundry that provides complementary products like a partner network, auto-scaling CLI, and operations interface, and is used by enterprise-level customers like T-Mobile, The Home Depot, and Comcast.
Collect and monitor Microsoft 365 audit logs with Datadog
Microsoft 365 is a suite of cloud-based productivity and communication services that includes Microsoft Office applications (including OneNote and OneDrive) as well as other popular Microsoft tools like Skype and Teams. Microsoft 365 tools and services are at the core of many organizations’ data management and day-to-day workflows, so monitoring activity across your environment is key to making sure that these services remain secure and meet compliance standards.


