Operations | Monitoring | ITSM | DevOps | Cloud

Oracle Functional Monitoring

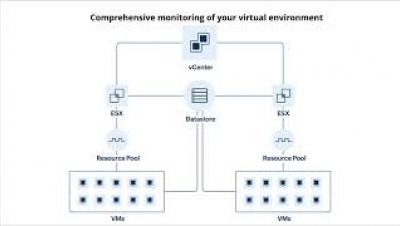
All databases provide a place to run applications. Monitoring an infrastructure is usually based on its technical components which goes on to extrapolate the health of its applications and programs. However, wouldn’t it be more efficient to monitor the application’s functionality itself? So imagine you have an Order application that consists of a Web UI frontend, Web API backend, business service and an Oracle Database.

Add context to your dashboards from SQL data sources New SQL tile: Line graph

Monitoring information that matters to you will often come from disparate sources – whether you are a server engineer, a SQL database administrator, or an application owner wanting a 360 view of your applications’ health. For example, you may want to visualise your server metrics from SCOM alongside historical trends from the SCOM Data Warehouse.

Introducing composite charts and Metric Correlations

We're really excited about supercharging Netdata Cloud's infrastructure monitoring experience with composite charts. These charts look just like the ones you're familiar with, but feature real-time, per-second aggregated metrics from any number of distributed nodes from across your infrastructure. You can still pan, zoom, and highlight to your heart's content while also changing the aggregate function, filtering nodes, or jumping straight into single-node dashboards for root cause analysis.

ObservabilityCON Day 4 recap: a panel discussion on observability (and its future), the benefits of Chaos Engineering, and an observability demo showcase

Over the past four days, Grafana Labs' ObservabilityCON 2020 brought together the Grafana community for talks dedicated to observability. We hope you enjoyed all of the sessions, which are available on demand now. (Link to them from the schedule on the event page). The conference wrapped up with predictions and advice from observability experts, lessons in failure, and Grafana Labs team members showcasing ways Grafana and other tools fit into an observability workflow.

JFrog & HashiCorp - Scale Your Developer's Talent

Join JFrog’s Baruch Sadogursky and HashiCorp’s Taylor Dolezal as they walk you through best practices for helping to enhance your team’s artifact experiences. Together HashiCorp and JFrog enable you to automate your application infrastructure end-to-end. While HashiCorp technologies implement Infrastructure as Code, the JFrog Platform manages all of the binaries, artifacts and dependencies for each build, and automates the software composition analysis, build information and deployment.

Infrastructure monitoring consolidation for achieving agile IT management

Managing large-scale deployments efficiently and resolving issues in a timely manner can be an easy task. What you need is a reliable and agile set of infrastructure monitoring tools for your enterprise IT infrastructure that possesses all the needed features for simple and stress-free management.