

Operations | Monitoring | ITSM | DevOps | Cloud

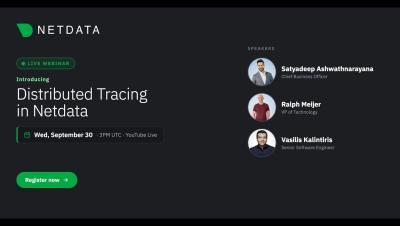
Introducing Distributed Tracing in Netdata

Netdata now supports distributed tracing. In this webinar, we'll demo the new tracing capabilities for the first time: OpenTelemetry trace ingestion, the new tracing dashboard, and the UI built to let you move from a metric anomaly to the exact span that caused it. For years, teams have asked us to close the gap between infrastructure monitoring and application performance. This release does that. Netdata can now ingest traces via OTEL, correlate them with the metrics and logs you already collect, and surface them in a purpose-built interface designed for speed and clarity.

How to Make Claude Your UI Design Companion

When I first tried Claude Design, shortly after it was released, I wasn’t impressed. As an every day Figma user, I missed the option to manipulate elements directly, especially for fine tuning details. What I overlooked at that point was the fact that it is really good at generating different options efficiently. Most of them aren’t usable, but getting these options suggested helps when exploring and combining different approaches and ideas.

Your On-Call Rotation Has a Single Point of Failure, and It Gets the Flu Every Winter

Most teams design on-call for the failures they can see in a dashboard. A region goes down, a deploy goes sideways, a certificate expires at 2 a.m. The rotation exists so that someone is always there to catch it. Far fewer teams design for the failure that takes out the catcher: the on-call engineer wakes up with a fever, and the plan for that is usually a Slack message and hope. Treat a sick engineer the way you would treat any other dependency outage. It is predictable, it is seasonal, and it has a blast radius that grows with every shortcut in the rotation design.

From PDF Reports to Leadership Decks: A Workflow for Ops and IT Teams

Operations and IT teams produce a steady stream of reports: monthly uptime summaries exported from monitoring tools, incident postmortems, SLA reports from vendors, security audit results, capacity reviews. Most of them end up as PDFs. Then someone from leadership asks for "a few slides for the quarterly review," and an engineer loses an afternoon copying text and screenshots into PowerPoint.

Adding Search and SEO Data to Your Data-Engineering Pipeline

A company can have a mature data warehouse and still handle search data in a surprisingly improvised way. Product events arrive automatically. CRM records are synchronized. Revenue tables refresh overnight. Search rankings, keyword metrics, and backlink data, meanwhile, may still appear as exports sitting in somebody's downloads folder.

Top 5 AI Pitch Deck Tools for Sales Teams That Cut Slide Creation Time

AI pitch-deck tools promise "60-second" creation, yet reps keep burning hours fixing fonts, charts, and brand colors. We benchmarked 12 contenders and timed every step-from first prompt to a client-ready PowerPoint or Google Slides file. Only five met our bar for deck quality, native editability, workflow speed, collaboration depth, value, and security. This guide shows which tool wins each sales scenario so you can choose based on data, not hype.

How Hybrid WAN Is Transforming Enterprise Network Connectivity

Enterprise networks are evolving as businesses adopt cloud applications, remote work, distributed offices, and connected devices. A hybrid WAN solution can help organizations combine different connectivity options while supporting the performance, reliability, and flexibility required by modern business operations.
Sponsored Post

Tutorial: How to Use ChaosSearch with Grafana for Observability

In my last blog post, Building a Cost-Effective Full Observability Solution Around Open APIs and CNCF Projects, we introduced using ChaosSearch in combination with the most popular open source front- and back-ends in the application observability space. In case you missed it, the TL;DR version is that you can use a variety of open source projects and open API-based components to build the best-of-breed observability stack of your choice rather than relying on expensive, all-in-one solutions.

API update: Better visibility into rate limits

We’ve updated the StatusGator API v3 to help you see how many requests your integration can make and handle rate limits more smoothly. Responses that count toward your organization’s per-minute limit now include three headers: If a request exceeds your limit, the API returns 429 Too Many Requests and a Retry-After header telling your integration how many seconds to wait before trying again.