Operations | Monitoring | ITSM | DevOps | Cloud
%term
2nd year in a row: Gartner recognizes ManageEngine in its Magic Quadrant for Network Performance Monitoring and Diagnostics
OpManager’s network monitoring capabilities have been serving the network administration industry for more than a decade. What started as a basic network monitoring tool has grown tremendously in terms of both features and operations, placing OpManager among the top network monitoring tools in the network administration domain.
A Comparison of VMware and Docker
Servers are expensive. And in single-application installations, most servers spend the majority of their time waiting. Making the most of these expensive assets led to virtualization, and making the most of virtualization has led to multiple options for virtualizing applications. VMware and Docker offer competing methods for virtualizing applications. Both technologies work to make the most of limited hardware resources, but they do so in significantly different ways.
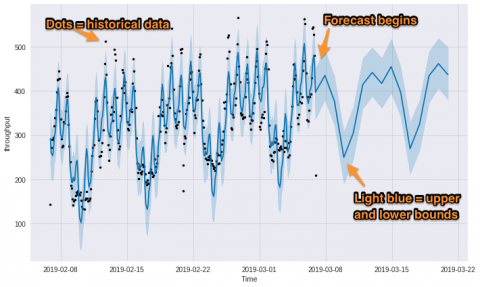
Google Colab+Prophet+Scout = Easy Web Traffic Forecasts
Forecasting traffic to your web app is important for capacity planning, but generating a seasonally accurate model of your traffic is pretty daunting.
LogicMonitor Recognized in the 2018 Gartner Magic Quadrant for Network Performance Monitoring and Diagnostics for the First Time
We’re excited to share that Gartner, Inc. has positioned LogicMonitor in the 2018 Gartner Magic Quadrant for Network Performance Monitoring and Diagnostics* (NPMD) for the first time in the quadrant’s history.
ContainerD meets Sysdig
Containers are fast becoming the defacto standard as a building block for creating and deploying applications. Containerization allows development teams to have consistent environments, cost optimizations, isolation, and versatility, in general. The open-source Containerd project is a critical component for the modern cloud-native containerized landscape, providing a runtime that is widely used in millions of applications every day.
Who Can Benefit From Unified Monitoring
Unified monitoring is for any organization that uses IT operations extensively in their business. Many times, the organizations who need unified monitoring have experienced outage and availability issues, have in-house solutions that struggle to scale or don’t meet regulatory requirements, lack of visibility into their infrastructure, or don’t have the ability to do reporting (for example: SLA compliance reports).
Business Process 2.2.0
Gut Ding will Weile haben. Or, Rome wasn’t built in a day. Though, I like the German version more because it’s not that quite a stretch. Well, what this is all about you ask? It’s been the first quarter of 2017 when the first version of the Icinga Business Process Module had the chance to impress its audience. It’s gone rather quiet since then. But don’t worry, just two years later there is the solution to the so-called order it imposed on us: Chaos.
AWS Costs: Surprise, Surprise? It Shouldn't Be!
A recent article by The Information: As AWS Use Soars, Companies Surprised by Cloud Bills was very interesting and worth a read. The authors examined the AWS spending patterns of five large companies to demonstrate that all were way over budget as it related to AWS spend. They reference Pinterest “spending roughly $190 million on AWS last year, $20 million more than it had initially expected... and Adobe’s bill rose 64%, while Capital One’s jumped 73%; Pinterest’s rose 41%...
Monitoring policy system in Pandora FMS. What they are like, what they are and where to find them
“Monitoring policy system”, “monitoring policy system”, “monitoring policy system”… As much as you repeat it, it still sounds boring, unappetizing and expensive. But you have to admit that an in-depth contact with the monitoring policy system, especially the system that concerns you, is also useful, convenient and practical after all. Therefore, to benefit you, we will start today with the policies in Pandora FMS.


