Operations | Monitoring | ITSM | DevOps | Cloud

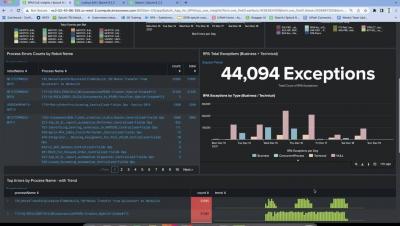
UiPath Robotic Process Monitoring for Splunk - Demo Walkthrough

This video provides a walkthrough of the out of the box Dashboards that come with the Splunk App for RPM. Once you have configured the data inputs you can quickly get value out of the app for monitoring your UiPath Robotic Process Automation (RPA) deployment. There is also a Splunk Alert Action built in which allows you to take action in UiPath API based on Data in the Splunk indexes.

Introducing Cloud Logging - Log Analytics, powered by BigQuery

Logging is a critical part of the software development lifecycle allowing developers to debug their apps, DevOps/SRE teams to troubleshoot issues, and security admins to analyze access. Cloud Logging provides a powerful pipeline to reliably ingest logs at scale and quickly find your logs. Today, we’re pleased to announce Log Analytics, a new set of features in Cloud Logging available in Preview, powered by BigQuery that allows you to gain even more insights and value from your logs.

How to Scale Your Alerts Beyond PromQL with Coralogix Flow Alerts

When building alerts, engineers aim to create accurate, timely, and actionable alerts. In pursuit of this goal, many engineers will leverage PromQL throughout their careers. PromQL is the query language used by Prometheus and Alert Manager to query metrics and define alerting rules. While PromQL works very well for simple use cases, as infrastructure scales, architectural patterns grow more complex, engineering practices accelerate, and alerting use cases become more multivariate.

Deploy your Next.js application on Vercel using Sentry and GitHub Actions

Thanks to the power of open source tooling and cloud services, shipping an application to production has never been that easy, In this blog post, we are going to go from bootstrapping a Next.js application to deploying it on Vercel. We will use Github Action to handle the Continuous Integration and Sentry to monitor the application once it is deployed to be warned of any problems as soon as it arrives.

Why You Need Synthetic Monitoring

Synthetic monitoring can be one of the most powerful tools in your DevOps team’s toolkit, especially for the SRE, yet is one that is often overlooked by people building out a reliability mindset. Synthetic monitoring permits you to simulate any transaction or interaction users can have in your website or app, from places around the world, as often as you’d like.

An Open Source Observability Platform | SigNoz

Cloud computing and containerization have brought many benefits to IT systems, like speed to market and on-demand scaling. But it has also increased operational complexity. Applications built on dynamic and distributed infrastructure are challenging to operate and maintain. A robust observability framework can help application owners stay on top of their software systems. In this article, we will introduce SigNoz - an open source observability platform.

The Complete Kubectl Cheat Sheet [PDF download]

Kubernetes is one of the most well-known open-source systems for automating and scaling containerized applications. Usually, you declare the state of the desired environment, and the system will work to keep that state stable. To make changes “on the fly,” you must engage with the Kubernetes API.

How to get complete CI/CD pipeline observability

It's not like it used to be back in the day! Before CI/CD, we were building on-premises, service-oriented products following system style architecture and we were able to map out the build system and end-to-end process in a PowerPoint or Visio document. Although time-consuming and inefficient, it was relatively straightforward and the build pipeline was unlikely to change drastically. But that's no longer the case.

PostgreSQL Monitoring Upgrade

Netdata for PostgreSQL monitoring just got a huge upgrade, collecting 100+ PostgreSQL metrics and displaying these across 60+ different composite charts. You can check the reference documentation for the full list of metrics, and see them running live in the demo space. If you are using PostgreSQL in production, it is crucial that you monitor it for potential issues. And the more comprehensive the monitoring the better!