Operations | Monitoring | ITSM | DevOps | Cloud

%term

What's New at OnPage: Enhanced Phone App and Security

Welcome to the latest OnPage phone app update! Our dedication to enhancing our product and streamlining customer workflows remains unwavering. In our continuous quest for improvement, we’re thrilled to unveil the latest enhancements to our application. We’ve listened intently to your feedback and are excited to announce a significant modernization of our phone application, showing our commitment to meeting your evolving needs.

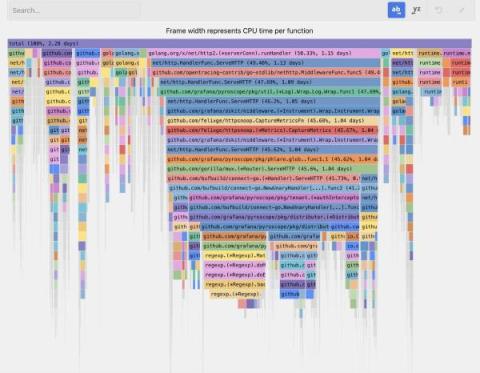
AI-powered insights for continuous profiling: introducing Flame graph AI in Grafana Cloud

Like many in the observability space, we see a lot of potential in harnessing AI to enhance the developer experience. As we continue to evolve and expand our observability platform, we strive to develop features that not only solve complex problems, but make it easier to access and derive value from tools like Grafana Pyroscope.

Tackling the Unsustainable Skills Challenge in Cybersecurity and Observability

This is the third and final post in a series of blog posts about the disconnect between modern IT and security teams and the vendors they’re forced to work with. If you’re looking for the first and second posts, you can find them here and here.

5 Top Kubernetes Observability Challenges and Solutions

Observability in IT refers to the ability to measure a system's internal functioning by studying its signals from the outside. Modern IT observability is achieved through three kinds of telemetry: metrics, traces, and logs. Metrics aggregate events to gauge a system’s current state. Tracing tracks the progress of each transaction to not only measure performance but also debug the problem. On the other hand, logs record each event, which can help during troubleshooting.

How to consolidate your incident response stack with PagerDuty

PagerDuty helps organizations manage the entire incident lifecycle to respond faster and more effectively while reducing costs. Move from manual, reactive incident management to an automated, proactive approach, making the incident response process more efficient and resilient.

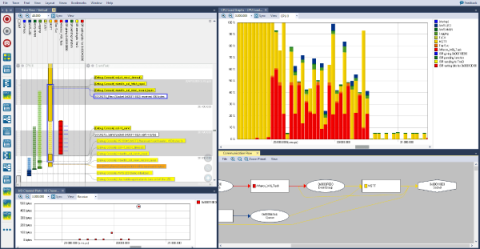
Major Improvements For Linux Users In Tracealyzer v4.9

Installation on Linux has been greatly simplified in the upcoming Tracealyzer v4.9. The installation package now includes everything needed to run the software. Linux users no longer need to install dependencies like Mono or libgconf. Instead, a native Linux binary is provided (for x86-64) with the Mono runtime integrated. Most other dependencies have been replaced or removed. You are up and running in a few minutes. We have also spent a lot of time improving the overall user experience on Linux.

Building for the Fortune 500,000: 80% to go...

To the Sentry community - It was sixteen years ago that David Cramer pushed the first commit to a side project, and twelve years ago when he and Chris Jennings turned this side project into a company that exists to solve a simple problem: making debugging any software issue dead simple. Since then, we’ve been on a path slightly different from what most people consider “observability.” Sentry isn’t a platform or a company that wants to collect logs and check a monitoring box.

Azure Storage Cost Optimization | How to reduce Azure Storage Costs?

Azure Storage Cost Optimization | How to reduce Azure Storage Costs? Azure MVP Michael Stephenson (aka Mike) introduces a new feature in Turbo360 that aims to optimize Azure storage costs. He begins by explaining customers' challenges with Azure's lifecycle policies and their desire for more control over optimization processes.

Navigating the Complexities of Hybrid and Multicloud Environments

Navigating the complexities of hybrid and multicloud environments can be daunting, but Kentik Cloud is here to help. In this video, we explore how Kentik's unified platform provides engineers with comprehensive visibility across hybrid and multicloud landscapes. Learn how Kentik ingests and visualizes data from various sources including public clouds, SaaS providers, private data centers, and more. See how you can drill down from a high-level overview to granular details such as specific IP addresses, VPC traffic, and performance metrics.