Operations | Monitoring | ITSM | DevOps | Cloud

The Place Where Modern Operations & Technology Come Together


Faster Android Debugging using Sentry - Demo
Join Sentry Solutions Engineer Simon Zhong for an introductory demo on accelerating Android debugging with Sentry.

WhatsUp Gold SNMP Table Active Monitor
Watch this video to learn how to monitor the dynamic SNMP tabular data on your network devices using WhatsUp Gold, even when the number of instances varies. As an example, we’ll demo how to create an active monitor for the percentage of disk space currently in use on a storage device.

What do you love about IPAM?
We asked Brian what he loves about his IPAM software, LightMesh.
Feature Spotlight - Failsafe Devices
Incident notifications are always time sensitive, so it’s crucial that teams and resolvers are set up to receive them. When an alert is sent to a group you belong to that uses failsafe devices, you can still receive the notification even if you don’t have any devices with an active timeframe. You can choose which device is used as a failsafe, giving you an extra layer of reassurance that you’ll never miss an important notification when it matters.

Subaru Cars Have A Massive Security Vulnerability
Security researchers found a massive flaw in Subaru’s remote vehicle system—hackers could unlock and track cars easily. The culprit? Homemade authentication protocols. Lesson: Don’t DIY security. Use trusted, third-party solutions. What do you think Subaru should have done differently?
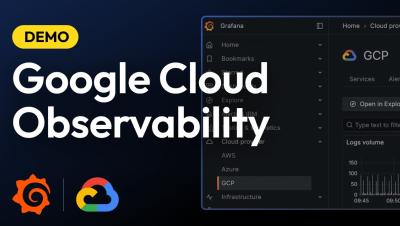
Observe Your Google Cloud Infrastructure | Demo: New Grafana Cloud Application | Grafana Labs
Want to monitor your Google Cloud infrastructure more effectively? Join Vasil Kaftandzhiev as he introduces Grafana Cloud’s new application designed specifically for Google Cloud observability. In this video, you'll discover how to: Optimize and troubleshoot your Google Cloud services Leverage out-of-the-box dashboards with key metrics and thresholds Set up comprehensive alerting for real-time incident response Streamline log management with an all-in-one logs view for faster root cause analysis Configure logs and metrics effortlessly using Grafana Alloy.

Switching things up with Auvik
Switch Gears This Year! Tolerating tedious and slow manual network processes is soooo 2024.

From Datadog to Grafana Cloud: Why companies migrate and how it changes business for the better
“Impossibly expensive.”“Generic database metrics.”“Exceeding limits.”“No transparency.” These are the words our customers use to explain why they looked for a Datadog alternative and migrated onto Grafana Labs’ observability solutions. Grafana Cloud provided the scalability that LexisNexis Risk Solutions needed to migrate acquired companies into a unified observability platform. “We’ve had migrations from Datadog.

Grafana Beyla 2.0: distributed traces, scalable Kubernetes deployments, and more
In November 2023, we released Grafana Beyla 1.0, the first major milestone in our pursuit of zero-code (and zero-effort) eBPF instrumentation. We delivered a way — through a single command-line — to automatically instrument any application supporting HTTP/gRPC protocols, as well as provide basic network packet flow information.