Operations | Monitoring | ITSM | DevOps | Cloud

Hyperview DCIM 3.11 Software Release

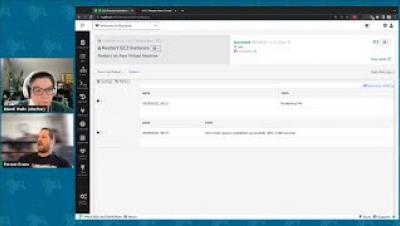
In this product update, we’ve introduced a new feature called Outlet Control that lets you power on, off, and cycle your rack PDUs remotely through the platform. We’ve also introduced a new persistent Search Bar and a Sensor Dashboard. Plus, we’ve made significant enhancements to the ServiceNow CMDB Sync integration, Catalog, Rack Security, and Heatmaps.

Announcing the public beta

We are thrilled to announce the public beta of Spectate, a next-gen monitoring and incident management platform. Initially built as an internal tool, Spectate has now been expanded to enable public use. Spectate allows you to monitor your websites, manage incidents and create elegant branded status pages. With Spectate, you can set up custom alerts and notifications that keep you informed about any issues, helping you to identify and address problems quickly with the help of our Incident AI.

The Definitive DevOps Tools List: 55 Tools For 2023

DevOps has exploded in popularity since the concept first emerged in 2009. A DevOps approach encompasses both practices and tools that engineers use to build quality software more rapidly. Before DevOps, software development followed a “waterfall” model. Back then, developers would code first, then perform quality assurance (QA) testing, and fix any bugs or errors as necessary.

Azure Blob Storage vs. Azure Table Storage: Which One is Right for You?

When it comes to storing data in the cloud, there are many options to choose from. Azure, one of the leading cloud service providers, offers a wide range of storage options, including Azure Blob Storage and Azure Table Storage. Both are designed to help businesses store and manage large amounts of data, but they have different use cases and capabilities. In this article, we will compare Azure Blob Storage and Azure Table Storage and help you determine which one is right for your business needs.

Getting Started with Google Cloud Managed Service for Prometheus

As you scale your services in production, you also need to scale your monitoring. Managing Prometheus at scale to handle increasingly large metric volumes can be a huge operational challenge, but Google Cloud Managed Service for Prometheus is here to help. We’re excited to introduce Google Cloud Managed Service for Prometheus and help you scale by removing operational toil!

Track Errors in Your NestJS Application with AppSignal

Many variables — such as your users' device type and configuration, external hosting services, and third-party libraries — can impact an application's performance. Without a performance monitoring system in place, numerous problems can arise. These issues could even mean that users stop using your application.

Strategies for Kubernetes Cluster Administrators: Understanding Pod Scheduling

Kubernetes has revolutionized container orchestration, allowing developers to deploy and manage applications at scale. However, as the complexity of a Kubernetes cluster grows, managing resources such as CPU and memory becomes more challenging. Efficient pod scheduling is critical to ensure optimal resource utilization and enable a stable and responsive environment for applications to run in.