Operations | Monitoring | ITSM | DevOps | Cloud

Why Migrate to Cloud Now?

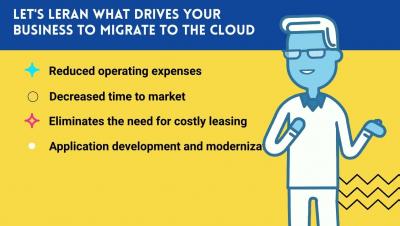
Cloud has become the go-to location for businesses to store data and build infrastructure. Many organizations have shifted their applications to cloud platforms, and many of those businesses that have their data on-premise ecosystem today are soon planning to migrate to the cloud. Studies reveal that the main drivers for cloud migration are security, cost-efficiency and modernization capabilities. But is not limited to this, a lot more is yet to realize. In respect of the current situation, the transition from legacy software and cloud is a strategic step. It is becoming a must-have step for business continuity for most companies.

Cloud or On-Prem? With Monitoring, It's Both-And, Not Either-Or

Despite the migration of services and systems to cloud (either all or in part), many of the fundamental aspects of the day-to-day work IT practitioners do hasn’t changed. It’s just moved. In this session, SolarWinds Head Geek Leon Adato and Technical Content Manager for Community Kevin M. Sparenberg discuss that state of affairs, as well as what monitoring can do to help view those resources as a contiguous whole, despite possibly being split across the on-prem/cloud divide.

Introducing the Lightstep Metrics plugin for Grafana

Chris Sackes is a Software Engineer at Lightstep. A New Yorker by birth, he loves public transportation, architecture photography, and urban exploration. He’s spent the last five years engineering delightful user experiences for a variety of applications. Lightstep’s powerful metrics reporting and analysis are now available for Grafana users. Using the new Lightstep Metrics plugin for Grafana, you can view metrics data reported to Lightstep directly in your Grafana instance.

Monitoring Amazon cloudfront with Graphite via Graphite APIs

MetricFire offers a complete system, infrastructure, and application monitoring using a suite of open-source monitoring tools. With MetricFire, you can monitor all your infrastructure on a single dashboard. The platform displays metrics on the dashboard using either Hosted Prometheus or Graphite-as-a-Service.

How Lowe's SRE reduced its mean time to recovery (MTTR) by over 80 percent

The stakes of managing Lowes.com have never been higher, and that means spotting, troubleshooting and recovering from incidents as quickly as possible, so that customers can continue to do business on our site. To do that, it’s crucial to have solid incident engineering practices in place. Resolving an incident means mitigating the impact and/or restoring the service to its previous condition.

The selling doesn't stop once the contract is signed

I have a long-time N-able partner whose account I managed off and on over the years. Although I am no longer in that role, we still keep in touch, chatting regularly about how their business is doing, and discussing their successes or any challenges they might currently be facing. This year, they set some pretty aggressive growth targets for their organization. Their revenues were off due to the pandemic, so they needed to regroup and double-down to make 2021 a more profitable year.

Introducing our open source SLO Tracker - A simple tool to track SLOs and Error Budget

One of the tools we use internally at Squadcast for SLO and Error Budget tracking is now open-source. In keeping up with the SRE ideology of automating as many ops tasks as possible, we built this SLO Tracker. We made this open-source so that the SRE community can also use it too. Looking forward to get your feedback, suggestions and patches :)