Operations | Monitoring | ITSM | DevOps | Cloud

All You Need To Know About Cloud Interconnection

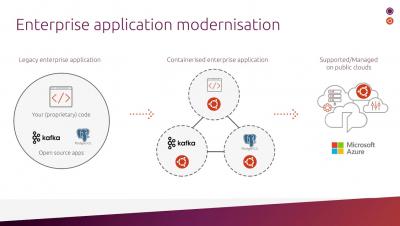
Many enterprises today have a range of assets residing in a mixture of both public and private clouds. As a result, there is a need to connect not just site-to-cloud but also cloud-to-cloud - use cases we would term Data Centre Interconnection (DCI) and Cloud Interconnection.

A Quick Guide to Log Shipping To Logz.io: Collectors, Code, and Clouds

One of the great things about Logz.io Log Management is that it’s based on the most popular open source logging technology out there: the ELK Stack (click here to view our thoughts and plans on the recent Elastic license). This means Logz.io users get to leverage log shipping and collector options within the rich ELK ecosystem. So how do you know which log shipping technology to use?

Webinar - Step Up Your DevOps Game with 4 Key Integrations for Jira & Bitbucket

Atlassian’s Ian Buchanan discusses how to integrate third-party DevOps tools with Atlassian’s robust DevOps ecosystem. You’ll learn about the benefits of an integrated tool stack, an introductions to 4 key DevOps practices, and examples of how those practices can integrate with Jira and/or Bitbucket.

Troubleshooting Large Queues in RabbitMQ

If you’re a RabbitMQ user, chances are that you’ve seen queues growing beyond their normal size. This causes messages to get consumed long after they have been published. If you’re familiar with Kafka monitoring, you’ll call it consumer lag, but in RabbitMQ-land it’s often called queue length or queue depth.

Top 5 New Relic Competitors and Alternatives to Try

New Relic is one popular for SaaS-based Application Performance Management capable of providing you with a flexible and dynamic approach to monitoring. It is considered to be effective but some may feel it is not cost-effective for small-meidum-size businesses and comes with a very high learning curve. If you want an APM that you can get started quickly, requiring minimal training or experience, New Relic may not be for you.

The new Splunk Infrastructure Monitoring plugin brings the SaaS formerly known as SignalFx to your Grafana dashboards

Greetings! This is Mike reporting from the Solutions Engineering team at Grafana Labs. In previous posts, you might have read our beginner’s guide to distributed tracing and how it can help to increase your application’s performance. In this post, we are back to talk about metrics and showcase another one of our newest favorite Enterprise plugins: Splunk Infrastructure Monitoring (formerly known as SignalFx)!

Maximize your Google Cloud Investment with LogicMonitor

LogicMonitor’s agentless architecture is designed for organizations adopting hybrid and multi-cloud environments to scale with ease. With an end-to-end view across important GCP services, IT Operations teams are equipped with real-time visibility into the health and performance of their entire distributed environments, maximizing value for GCP investments whether fully deployed or just getting started with cloud migration.

The next Big Thing in Azure Database Monitoring Landscape

Today’s applications are expected to be highly responsive and always online. Such circumstances excite the pressure on applications to respond in real-time to large changes in usage at peak hours, store ever-increasing volumes of data and make it available in milliseconds. Azure Database Services comes to rescue in such situations, and Azure supports many industry-standard databases and APIs.