Operations | Monitoring | ITSM | DevOps | Cloud


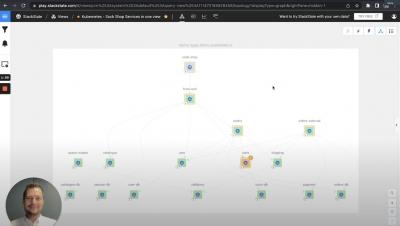

How to Scale with DX UIM's Monitoring Configuration Service, Part 1: Introduction
For today’s IT operations teams, the stakes keep getting higher and demands only intensify. The services these teams are responsible for managing play an increasingly critical role in the prospects of the business, which means optimizing service levels is an absolute imperative. Meanwhile, the environments in play only seem to keep getting larger, more complex, and more dynamic. Given these factors, monitoring is a task that keeps getting more vital and more difficult.
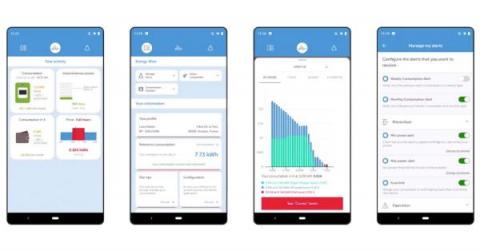
Real-Time Energy Management with InfluxDB and eSoftLink IoT Platform
Smart energy IoT platforms are empowering consumers to track energy usage and even control spend based on their next bill’s forecast. Yet eSoftThings, a specialist in the Internet of Things (IoT) and artificial intelligence (AI), set out to push smart energy management even further, for both consumers and utility companies, through its IoT platform eSoftLink.

Welcome to Grafanafest

Verify image signatures with GitHub Actions and KeylessPrefix
With the latest releases of Kubewarden v1.1.0 and the verify-image-signatures policy, it’s now possible to use GithubActions or KeylessPrefix for verifying images. Read our previous blog post if you want to learn more about how to verify container images with Sigstore using Kubewarden.

Alan Nance on the Importance of an Experience Optimization Framework

6 Best Practices to Create a Data Center Naming Convention
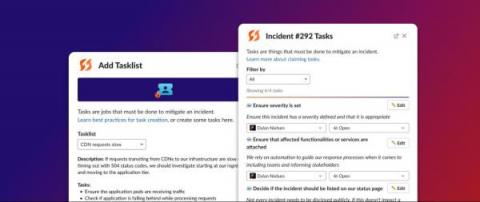
FireHydrant Tasks provide turn-by-turn navigation during an incident
An incident has been declared and your runbook has fired. Everyone is gathered in your Slack channel, the tickets are opened, and roles are assigned. Now what? This is when most teams manually update status pages and kickoff investigation streams using a patchwork of tribal knowledge and supporting playbook documents.

How to Monitor PHP-FPM with Prometheus
PHP is one of the most popular open source programming languages on the internet, used for web development platforms such as Magento, WordPress, or Drupal. In addition to all PHP bases, PHP-FPM is the most popular alternative implementation of PHP FastCGI. It has additional features which are really useful for high-traffic websites. In this article, you’ll learn how to monitor PHP-FPM with Prometheus.

Harnessing the whole organization to create a better customer experience
Creating an effortless customer experience is one of the key imperatives facing customer service leaders today. Providing experiences without friction is a crucial step in enabling organizations to be more responsive and agile while improving employee productivity, satisfaction, and retention.