Operations | Monitoring | ITSM | DevOps | Cloud

Understanding Remote Access Protocols

“Remote access makes everyone’s jobs easier,” MSP360 states. Thanks to remote access, organizations and their departments are able to collaborate and perform even with fully remote or hybrid workforces. In order for remote access to work properly, organizations connect their remote servers to endpoints using remote access protocols. Let’s dive into remote access protocols and find out how they are used in today’s tech environments.

Kubecost and Qovery Team up to Offer Cost Monitoring for DevOps Teams

We are thrilled to announce our partnership with Kubecost, a game-changing provider of cost monitoring for Kubernetes clusters. This collaboration marks a new era in efficiency and cost-effectiveness for DevOps teams everywhere. With Kubecost's advanced monitoring capabilities integrated into our own Kubernetes deployment platform, we are empowering organizations to take control of their cloud-native infrastructure like never before.

4 Unique Time Series Workloads for InfluxDB, Powered by IOx

Data is kind of like Newton’s first law of motion. Data is just that unless acted upon by something else. Time series data, therefore, is something you derive from data. We generally derive time series data to record historical observations about a physical or virtual system (for example, think of sensors and servers, respectively). However, not all time series data is the same. There are different use cases for time series data, and each has its own workload needs.

Differences Between Block Blobs, Append Blobs, and Page Blobs

Azure Blob Storage is a cloud-based storage solution that enables developers to store and manage large amounts of unstructured data. Blob storage can store any type of text or binary data, such as documents, images, audio, and video files. Blobs are divided into three types: block blobs, append blobs, and page blobs. Each type of blob has its unique characteristics and is used for different purposes.

Understanding Distributed Tracing with a Message Bus

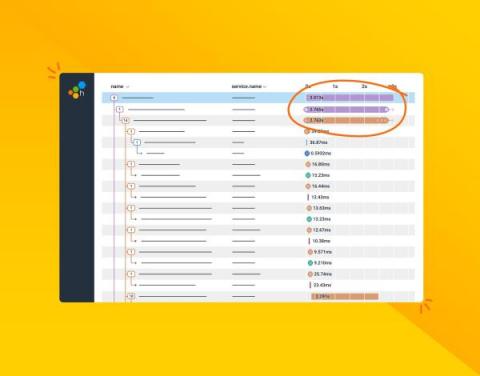
So you're used to debugging systems using a distributed trace, but your system is about to introduce a message queue—and that will work the same… right? Unfortunately, in a lot of implementations, this isn't the case. In this post, we'll talk about trace propagation (manual and OpenTelemetry), W3C tracing, and also where a trace might start and finish.

Observability from Development to Production with Platform.sh Observability

With Platform.sh and Blackfire.io monitor, profile and test your application even before it is released in production. Get actionable insights to improve your code rather than spend time figuring out what’s wrong. Ensure optimal performance and user experience for your web applications.

Troubleshoot faulty frontend deployments with Deployment Tracking in RUM

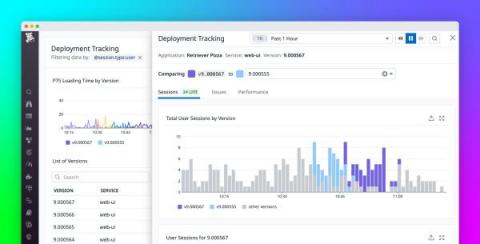
Many developers and product teams are iterating faster and deploying more frequently to meet user expectations for responsive and optimized apps. These constant deployments—which can number in the dozens or even hundreds per day for larger organizations—are essential for keeping your customer base engaged and delighted. However, they also make it harder to pinpoint the exact deployment that led to a rise in errors, a new error, or a performance regression in your app.