Operations | Monitoring | ITSM | DevOps | Cloud

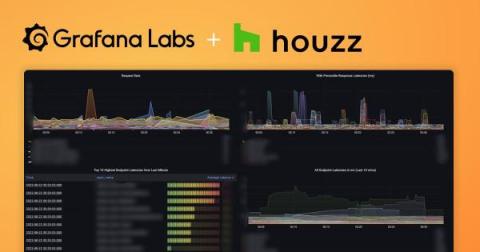
How to reduce MTTR with Grafana Loki and Grafana Tempo: Inside the Houzz observability renovation

Houzz is where millions of homeowners and home improvement professionals go to seek inspiration and supplies for their remodeling projects. But to continue as the leading platform for home remodeling and design, the Houzz tech stack needed a renovation of its own as the company scaled. In response, the Houzz team began by revamping their monoliths into microservices.


How to Monitor the Use of Pirated Software Inside the Organization

There are costly outcomes for any organization as a result of not knowing how to monitor pirated software. Hence, detecting it should be part of your internal software audits. Pirated software can be a source of malware, putting your entire IT infrastructure at risk. As you probably know, copying software and sharing it for free with anyone else is deemed copyright infringement.

The Theme Park Workplace: A Modern Approach to IT Operations

IT teams in modern workplaces are no longer spending the bulk of their time troubleshooting and break/fixing issues. As in any service industry in the consumer world, IT service workers are now expected to deliver a great experience to their consumers – the employees. Managing the workplace has become much more like managing a theme park, where every aspect of its real estate should exhibit interest, joy, and fun; everything that makes up a great experience.

Four tests to measure and improve reliability: what matters and how it works

Legendary race car driver Carroll Smith once said, "until we have established reliability, there is no sense at all in wasting time trying to make the thing go faster." Even though he was referring to cars, the same goes for technology: no amount of code optimization or new features can replace stable systems. Unfortunately, much like race cars, it's hard to know that a system is unreliable until it blows a tire, the brakes stop working, or the steering wheel comes off the column.

Tools for Time Series Data Science Problems with InfluxDB

This article was originally published in The New Stack and is reposted here with permission. You might need to perform anomaly detection or forecasting if you’re working with time-series data. The first step before working on your time series is finding the right data store. To effectively detect or forecast your data, you will require a data store that can handle a large volume of data at a high ingest rate. Therefore, you might want to look at using a purpose-built time-series database.

Feature Focus: August 2022

It’s already September! Time flies by when you’re getting things done, and we’ve been a busy bunch of bees here at Honeycomb. 🐝 We’re excited that we’ve gotten to share some of those changes with you already, like our relaunched interactive sandbox and the beta release of our OpenTelemetry log support and Go distribution, but that’s just the tip of the iceberg.

Measuring Cloud Unit Costs for FinOps

Cloud adoption has been on an upward trajectory for over a decade with no signs of slowing down. As widescale migration becomes the norm, organizations are realizing cloud financial management — also referred to as FinOps — is critical to creating long term value in the cloud. Building a culture of financial discipline requires visibility and a strategy for measuring success along the way.

How to add a Golden Signal to a service in Gremlin RM

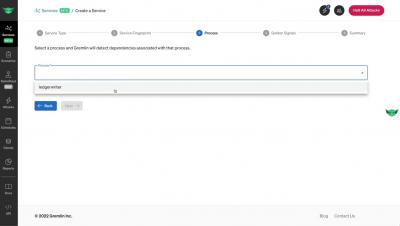
In this video, we show you how to add a Golden Signal to a service. Gremlin uses your Golden Signals to ensure your services are still healthy and responsive during reliability tests. You can configure Golden Signals to use an existing monitor in your observability tools, such as Datadog, New Relic, or Prometheus. We recommend adding all four Golden Signals to each of your services to ensure comprehensive coverage.