Interrupts are often seen as a problem that eats away at your team’s productivity, and gets in the way of shipping important things for your customers. It’s often consciously accrued from the tech debt we accept to ship features sooner. However when a team doesn’t have a good strategy for dealing with the consequences of those decisions, the pain is felt much more acutely and much sooner.
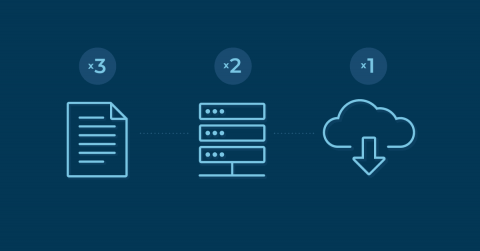
Data disasters are practically inevitable, but a planned out backup strategy can combat their damaging effects. The Cybersecurity and Infrastructure Security Agency (CISA) of the U.S. government is a major organization that recommends sticking to a 3-2-1 backup strategy. Follow the 3-2-1 backup rule to ensure that your data is kept safe.
The demand for cloud services is rising. Databases have been popular tools for a long time. However, the landscape is changing, with cloud databases becoming increasingly popular.
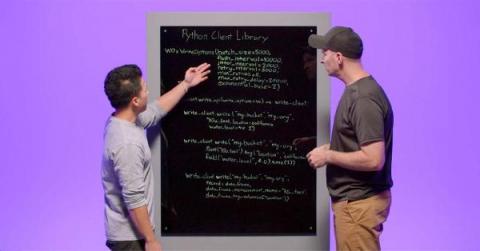
InfluxDB has over a dozen different client libraries to help developers work with time series data in whatever programming language they like best. The Python client library is one of our most popular options. It’s simple to learn, and working with InfluxDB in a language you’re comfortable with helps you get started doing powerful time series analysis quickly.
This is the second post in a 2 part blog series on debugging, monitoring and tracing NodeJS Lambda applications. If you haven’t yet seen part 1, check it out here (it’s a great read!) Now let’s get back into our post with one of the most commonly experienced issues when it comes to Lambda functions, Cold Starts.
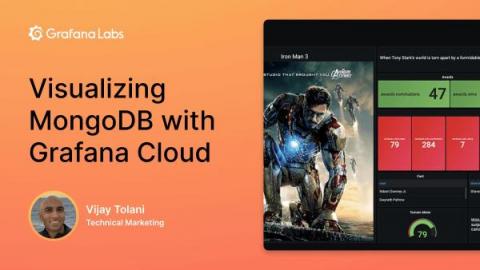
MongoDB is one of the most popular NoSQL databases in the world, used by millions of developers to store application metrics from e-commerce transactions to user logins. The MongoDB Enterprise plugin for Grafana — which is available for users with a Grafana Cloud account or with a Grafana Enterprise license — unlocks all of the data stored in MongoDB as well as diagnostic metrics for monitoring MongoDB itself for visualization, exploration, and alerting.