Operations | Monitoring | ITSM | DevOps | Cloud

The Easiest Way to Monitor Node.js: Automatic Instrumentation

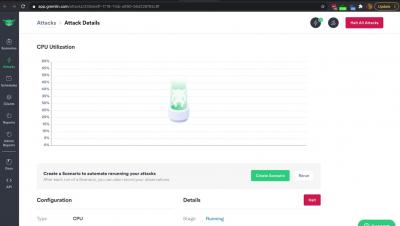
Monitoring for your Node.js apps can be hard. The tricky part is understanding what you need to monitor, instrumenting your code, and then making sense of all the data that’s been emitted. (That’s almost every part you might say 😅 ). At AppSignal, we dogfood our product and understand the pain users feel ourselves. The key points we focus on are the ease of use, flexibility, and developer experience.

Best Alternatives to Azure Monitor

Due to rapid cloud adoption and with never-ending user requirements, the Azure architecture might become complex and you might eventually lose sight of the overall cloud estate and how it relates to each other. Since the Azure portal was designed in a technology vertical silo and it has near zero application visibility, it is not possible to monitor them as a business application in the Azure portal.

Outlier Detection: The Different Types of Outliers

Time series anomaly detection is a tool that detects unusual behavior, whether it's hurtful or advantageous for the business. In either case, quick outlier detection and outlier analysis can enable you to adjust your course quickly, before you lose customers, revenue, or an opportunity. The first step is knowing what types of outliers you’re up against. Chief Data Scientist Ira Cohen, co-founder of Autonomous Business Monitoring platform Anodot, covers the three main categories of outliers and how you'll see them arise in a business context.

Vulnerability Management with ManageEngine Vulnerability Manager Plus

Vulnerability management is the cyclical process of identifying, evaluating, treating, and reporting on threats and vulnerabilities across your network endpoints. In this video, we take an in-depth look at the exhaustive threat and vulnerability management features of ManageEngine Vulnerability Manager Plus.

Observability: is it a future of monitoring

As a concept, observability has been a relatively recent entrant into the world of information technology and cloud technology. The idea originated initially from controls system engineering. Observability refers to the concept of inferring the internal status of the system based on the outputs derived from the same. This is the conventional definition of observability.

Knowing How Much to Spend on the AWS Elastic Load Balancer

Load balancing is an element of most popular web applications. The reason for this is simple: Load balancers maintain application scalability and sustainability. It’s nearly impossible to imagine a modern application handling continuous traffic or periodic traffic spikes while relying only on a single running server’s capacity. As a result, load balancers have become a critical part of software development.

How to create fast queries with Loki's LogQL to filter terabytes of logs in seconds

LogQL, the Loki query language, is heavily inspired by Prometheus PromQL. However, when it comes to filtering logs and finding the needle in the haystack, the query language is very specific to Loki. In this article we’ll give you all the tips to create fast filter queries that can filter terabytes of data in seconds. In Loki there are three types of filters that you can use.