Operations | Monitoring | ITSM | DevOps | Cloud

Grafana

Grafana Agent v0.34 release: Extended Kubernetes monitoring, support for HashiCorp Vault, and more

Grafana Agent v0.34 is now available! The v0.34 release includes features for remote secrets, better Kubernetes integration, and above all, more community involvement. The Grafana Agent team is also excited to continue driving growth around Grafana Agent Flow, a configuration mode that makes Grafana Agent easier and more powerful to run.

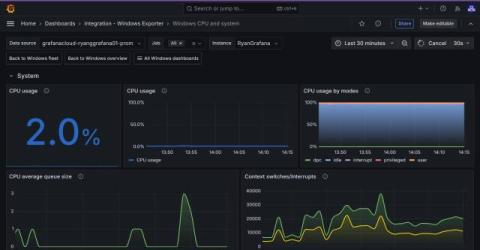
Easily monitor Docker Desktop containers with Grafana Cloud

18 million — that’s the number of developers around the world who use Docker, the popular tool for containerization. Docker Desktop, a software application for Mac, Windows, and Linux, is one of the most widely used tools within the Docker ecosystem, especially among developers who want to build, test, and deploy applications in containers on their local machines.

Continuous profiling now in public preview in Grafana Cloud

When we announced that Pyroscope was joining Grafana Labs back in March, we expressed our excitement that uniting the Pyroscope and Phlare open source projects and teams would accelerate our plan to add continuous profiling to Grafana Cloud. Just two and a half months later, that day has come! We are proud to announce that Grafana Cloud Profiles is now available in public preview for all Grafana Cloud users, both paid and free.

Introducing powerful APIs and webhooks for Grafana Incident

Grafana Incident, Grafana’s powerful incident response tool, comes with a range of integrations out of the box, including Zoom and Google Meet spaces, GitHub and JIRA issues, and even a Google Doc template for post-incident review documents. However, every team has unique needs and workflows, and you may need to integrate with other systems not currently on our roadmap or even use your own in-house tools.

Web performance testing: Compare Grafana k6 browser vs. Google Lighthouse

The Grafana k6 browser module simulates how users interact with a browser page and collects web performance metrics about the interaction. Since launching the module in 2021, we’re frequently asked how it compares to Google Lighthouse as a tool to measure web page performance. This blog post compares k6 browser and Google Lighthouse from various perspectives, including: Note: k6 browser is a part of Grafana k6 OSS.

Grafana Labs partners with GitHub to enable secret scanning

As part of our ongoing commitment to security, we are excited to announce we have partnered with GitHub to protect our users on public repositories via GitHub’s secret-scanning feature. Through the partnership, GitHub will notify Grafana Labs when one of the following secret types is exposed in the code of a public repository: GitHub actively monitors public repositories for leaked secrets. When a secret is detected, its hash is stored in Grafana Labs’ Secret Scanning API.

How to start monitoring your ClickHouse instance or cluster with Grafana Cloud

ClickHouse is an open source, column-oriented database management system designed for OLAP (analytical) workloads. ClickHouse supports various data formats and SQL queries, and is popular for clickstream analysis as well as log processing use cases. We are pleased to announce that ClickHouse now has a dedicated observability integration in Grafana Cloud, which makes it easy to troubleshoot issues, track potential latency, and prevent data loss.

Monitoring smart cities with Grafana, Timescale, and Sentilo

Miquel is a Project Manager at Seidor Opentrends, focused on smart cities, data, and IoT projects. Seidor Opentrends, which is headquartered in Barcelona and has offices around the world, provides end-to-end, high quality IT transformation services and serves as a consultant on open source and software architecture for municipalities throughout Spain. At Seidor OpenTrends, we build and maintain Sentilo, an open source sensor and actuator platform for smart cities.

How to manage CVE security vulnerabilities with Grafana, MergeStat, and OSV-Scanner

Patrick DeVivo is a software engineer and founder of MergeStat, an open source project that makes it possible to query the contents, history, and metadata of source code with SQL. The security posture of software supply chains has been a significant topic lately. Recent high-profile breaches have shown the importance of managing risks from third party code. Take, for example, the Log4Shell vulnerability (tracked as CVE-2021-44228 — Grafana Labs was not affected).

Grafana Cloud k6: What's new and what's next?

To ensure the best possible end-user experience, engineering teams must be able to seamlessly transition from performance testing to problem resolution, breaking down any silos that exist between the two. That’s why, earlier this year, Grafana Labs launched Grafana Cloud k6, a unified platform that natively integrates the Grafana k6 performance testing experience directly into Grafana Cloud.