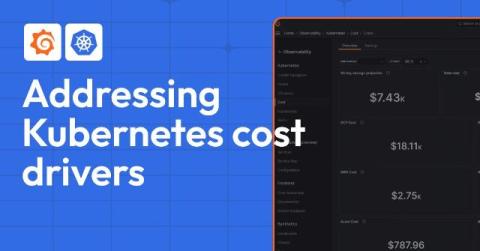
You’ve convinced your organization that cloud native is the way forward. You’ve championed Kubernetes and sworn by Prometheus. You’ve onboarded multiple teams to your centralized observability platform. Then you open your latest bill and see a lot of commas in your invoice, and a sinking feeling sets in. Sound familiar? We’re keenly aware of the pain this can bring. As metric cardinality grows in cloud native environments, so does the cost to store and retrieve the data.
A sysadmin in the high performance computing world since 2008, Wilfried Roset is now working with the open source databases and observability environment at OVHcloud. He leads a team focused on building industrialized, resilient, and efficient solutions. For nearly two decades, OVHcloud has been a leader in cloud hosting and has been Europe’s largest provider since 2011. To serve our 1.4 million customers globally, we need a reliable and scalable observability platform.
At Grafana Labs, we value the open source community and recognize the power of crowdsourcing. This is why we have decided to launch our very own bug bounty program, managed in-house by our own team, to encourage ethical hackers from around the world to help us find and responsibly report security vulnerabilities in Grafana Labs software.
With the arrival of Grafana 9.5, we’re excited to introduce Grafana support bundles — a tool to help debug your Grafana instance faster and more easily. Support bundles provide a simple way to gather and share information about your Grafana instance, and this feature is available across all tiers in Grafana Cloud as well as in Grafana OSS and Grafana Enterprise.
Grafana Agent v0.33 is here! This new release includes a lot of exciting features, such as a powerful way to configure Grafana Agent with Flow Modules and the ability to monitor Kubernetes pods in your cluster with an Operator Flow component. We also added many more Flow components making the Flow ecosystem bigger!
At ObserabilityCON 2022, we announced a limited private preview program for Grafana Cloud Frontend Observability, our hosted service for real user monitoring. Today we are excited to introduce a public preview program that makes Frontend Observability accessible to all Grafana Cloud users, including those in our generous free-forever tier. Simply look for Frontend under Apps in the left-hand navigation of the Grafana Cloud UI and click through to set up the feature. (Not a Grafana Cloud user?
Grafana Tempo 2.1 is out and comes with a host of TraceQL improvements. Tempo 2.1 comes with some nice incremental improvements to TraceQL and likely some breaking changes. There’s a section down below about those, too.
As a Grafanista, you tend to find things to visualize — databases, microservices, classic video games, etc. It’s part of our “big tent” philosophy. So when our December hackathon rolled around, some of us in our internal homelab Slack channel decided to take a look at how we could get metrics out of our Plex Media Servers.
Grafana k6 v0.44.0 has been released, featuring new experimental modules, an upgraded browser module, and tons of improvements. Get Grafana k6 0.44.0 Here’s a quick overview of the latest k6 news from the team and the community.