Incident Management for Status Pages
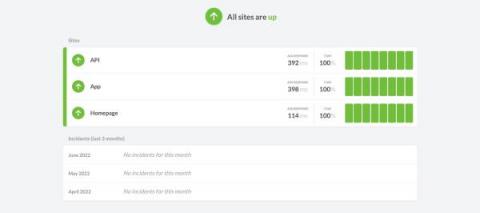
Honeybadger's new incident management feature lets you report incidents in real time, schedule alerts for upcoming maintenance, or retroactively insert an update for past incidents.


Honeybadger's new incident management feature lets you report incidents in real time, schedule alerts for upcoming maintenance, or retroactively insert an update for past incidents.
We are proud to introduce the world to the most recent release of GitLens. We have added richer GitLab integration, Gerrit support, the ability to reorder your commits when making an interactive rebase, and more. We can’t wait for you to read all about what’s new in GitLens 12.1!
Cribl Packs are, in my opinion, our most exciting feature. Packs encapsulate the deep log processing capabilities and enable sharing of the best practices with customers, Worker Groups/Fleets, and the Community. Ease of sharing enables consistent configurations across distributed deployments of Cribl Stream or Cribl Edge. All users can leverage Packs–and should! If you collect Microsoft Windows Logs, use Palo Alto Networks or share logs via Syslog, Packs are for you.
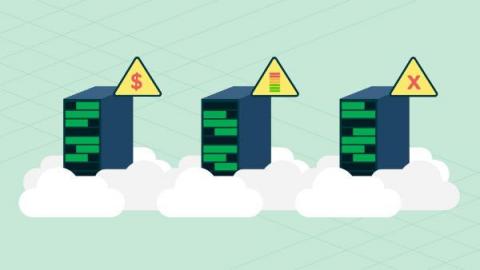
The DevOps field is engaged in a great, collective migration into the cloud. Businesses are decentralizing their applications and databases, hosting them in the cloud to make them available regardless of geography or user device. Some organizations choose to host their applications on private servers, but in periods of high demand take advantage of the public cloud by directing overflow traffic to cloud servers. This approach is called cloud bursting.
Say you have a new code base to study or picked up an open source project. You might be a seasoned developer for whom this is another project in a packed resume. Alternatively, you might be a junior engineer for whom this is the first “real” project. It doesn’t matter! With completely new source code repositories, we still know nothing… The seasoned senior might have a leg up in finding some things and recognizing patterns.