Operations | Monitoring | ITSM | DevOps | Cloud
%term
August 2018 Online Meetup: Building a CI/CD Pipeline with Kubernetes and Rancher 2 0
How to monitor JavaEE applications' EJB method performance on WebLogic?
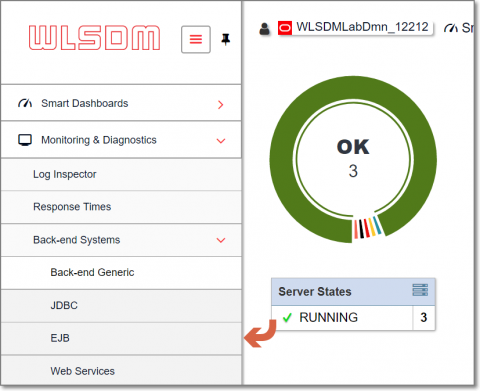
Previously on WLSDM blog, we have learned about monitoring applications’ database statements (JDBC SQL) and performance on Oracle WebLogic server. In this blog post we have created another tutorial to learn how to monitor and diagnose WLSDM back-end EJB business method invocation events.
Set Up for Success: Service Taxonomies in PagerDuty
It’s 2:37 a.m. on a Tuesday night, you’re asleep—but it’s also your turn to be on call. You receive a phone call from PagerDuty. Your partner hits you with a pillow in an attempt to wake you up. It worked. You groggily answer the call and hear your favorite robo-guy on the other end of the line.
Share Context With Collaboration: Suggested Query Boards
Nobody knows your services/infra better than you, not even Honeycomb. If there’s one maxim for Honeycomb, it’s that context is king. Context determines the questions you can ask. The only way to make complex systems truly tractable is to make all questions possible. Ergo: more context. Context everywhere. Context coming out of the walls. You should be awash in context.
The Power of the Dark Side - Challenge and Opportunity Presented by Dark Data
The concept of dark data is only just starting to gain prominence in IT circles. However, there is still a lot of confusion as to just what the term refers to, and the nature of the challenges and opportunities presented by the phenomenon.
Uptrends
logz.io
Monitoring Server Performance
This is the first in a series on server monitoring. The primary focus of these posts is monitoring in a *nix environment. Monitoring servers is important. Whether it be finding an issue in a test environment prior to deploying or debugging an issue in production, we need access to information on our server to be able to tease apart what went wrong.
Introducing Enhanced Zendesk Integration and New Integration Framework
OpsGenie is pleased to announce an enhanced integration with Zendesk, building off of our existing bidirectional integration to now support incidents.


