Operations | Monitoring | ITSM | DevOps | Cloud
Cloud
The latest News and Information on Cloud monitoring, security and related technologies.
How Cloud Suitability Analyzer Can Help Speed Up App Modernization
Eco - Cost & lifecycle management for commitment purchasing
Kubernetes right-sizing at the container level for fine-tuned application efficiency
Spot by NetApp’s Ocean continuously optimizes Kubernetes clusters with a wide feature-set tackling different aspects of running and managing Kubernetes containers in a cloud environment. One such aspect are the container resource requests defined in the cluster (upon which Ocean intelligently bin-packs pods on the underlying cloud VMs). Incorrect assumptions regarding the CPU and Memory required for an application, can incur unnecessary and costly cloud infrastructure waste.
CloudSpend - The cloud cost management tool for AWS
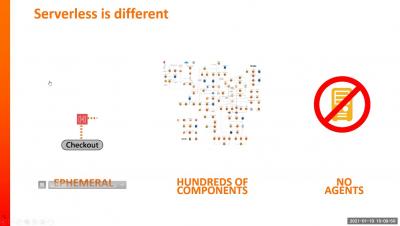
How Dashbird innovates serverless monitoring
At first glance, all serverless monitoring services seem similar and aim to solve the same problems. However, in Dashbird, we have made decisions that fundamentally differentiate us from our competitors since day one. Over time, those differences have magnified and we have found increasing confirmation and confidence in our approach. Dashbird product strategy is based on three core pillars.
How to monitor and debug AppSync APIs
AWS AppSync is a fully managed GraphQL service that makes it easy for you to build scalable and performant GraphQL APIs without having to manage any infrastructure! With AppSync, you get a lot of capabilities out of the box. Such as the ability to integrate directly with DynamoDB, ElasticSearch, Aurora Serverless, and Lambda. AppSync also supports both per-request as well as per-resolver caching and has built-in integration with CloudWatch and X-Ray.
Best Practices for Monitoring Applications Running on Azure App Service
How to Troubleshoot AWS Lambda Log Collection in Coralogix
AWS Lambda is a serverless compute service that runs your code in response to events and automatically manages the underlying compute resources for you. The code that runs on the AWS Lambda service is called Lambda functions, and the events the functions respond to are called triggers. Lambda functions are very useful for log collection (think of log arrival as a trigger), and Coralogix makes extensive use of them in its AWS integrations.
Cloud Profiler provides app performance insights, without the overhead
Do you have an application that’s a little… sluggish? Cloud Profiler, Google Cloud’s continuous application profiling tool, can quickly find poor performing code that slows your app performance and drives up your compute bill. In fact, by helping you find the source of memory leaks and other errors, Profiler has helped some of Google Cloud’s largest accounts reduce their CPU consumption by double-digit percentage points.


