Operations | Monitoring | ITSM | DevOps | Cloud

Latest Blogs

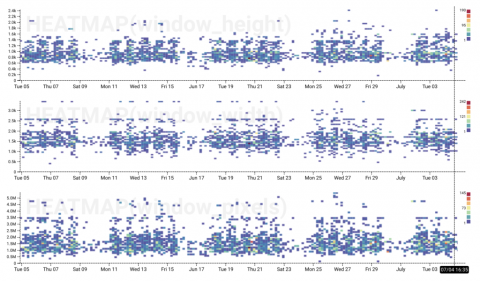
Level Up With Derived Columns: Understanding Screen Size (With Basic Arithmetic)

When we released derived columns last year, we already knew they were a powerful way to manipulate and explore data in Honeycomb, but we didn’t realize just how many different ways folks could use them. We use them all the time to improve our perspective when looking at data as we use Honeycomb internally, so we decided to share. So, in this series, Honeycombers share their favorite derived column use cases and explain how to achieve them.

You Can Improve Your Customer Satisfaction Charlie Brown!

What’s surprising to see today is how business operations struggle to get an integrated view of all business metrics. With greater volumes of data being collected, data analysts just can’t keep up with the pace. This state of affairs alone doesn’t hit as hard as the fact that many in data analytics have just come to accept this situation as a norm and simply bear with this daily struggle.

Thoughts from Gartner's 2018 Security & Risk Management Summit

I always look forward to attending the annual Gartner Security & Risk Management Summit in National Harbor, Maryland. This event provides the latest insights from both Gartner and industry thought leaders, and is focused on many current challenges facing organizations today with key areas including agile architectures, business continuity management (BCM), cloud security, privacy and securing internet of things (IoT).”

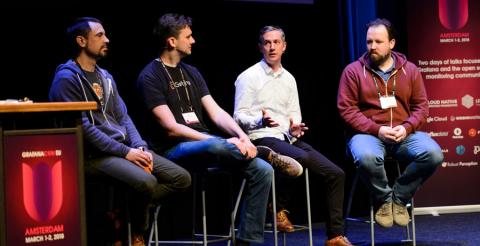
GrafanaCon Recap: The State of TSDB

At GrafanaCon EU, we gathered representatives of the Graphite, Prometheus, InfluxDB, and Timescale projects in the hopes of starting a spirited conversation about the current state of Time Series Databases. They didn’t disappoint! Here are a few highlights from the TSDB panel featuring Erik Nordstrom from Timescale, Dan Cech from Graphite, Paul Dix from InfluxDB, and Tom Wilkie from Prometheus, and moderated by Grafana Labs co-founder and CEO Raj Dutt.

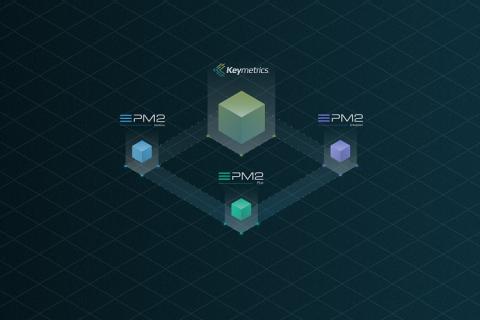
From Keymetrics to PM2 +

5 years. It's been an amazing journey to build Keymetrics and PM2 through the last 5 years. I've started to create PM2 when Node.js was at the beginning of its fame, then Keymetrics was built a year after. I would like to say THANK YOU, to all of you, users, customers, teammates, maintainers, contributors for having made these softwares reach this height.

5 Challenges and Solutions of Migrating to the AWS Cloud

Modern IT environments are far too complex and dynamic for traditional tools. Successful IT organizations have figured out that before, during, and after a migration to AWS, OpsGenie is a critical tool to monitor and alert on concerns for on-premise, hybrid solutions (on-premise with some part in the cloud), or fully in AWS.

Monitoring Flask apps with Datadog

Flask is a Python framework known for its ease of use. It inherits Python’s advantages of extensibility, broad support, and relative simplicity. It’s known as a microframework because it relies on extensions for much of its functionality. Flask avoids constraining the developer to a predetermined database or authentication mechanism, for example, and instead leaves room for choice.

Adopting a SIEM solution, Part 2: What should you consider when choosing a SIEM tool?

In part one of this two-part series, we discussed why organizations should adopt a SIEM solution to ensure network security. In this second part, we’ll be demystifying the critical capabilities of SIEM tools and show you what to consider when picking a solution.

Air Quality Sensors and IoT Systems Monitoring

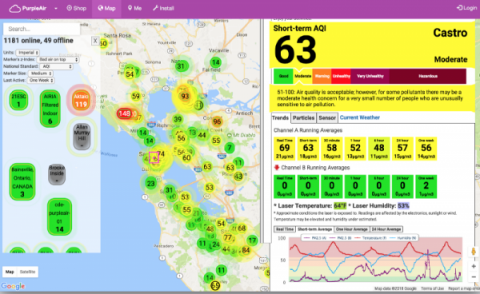
2017 was a bad year for fires in California. The Tubbs Fire in Sonoma County in October destroyed whole neighborhoods and sent toxic smoke south through most of the San Francisco Bay Area. The Air Quality Index (AQI) for parts of that area went up past the unhealthy level (101–150) to the hazardous level (301–500) at certain points during the fire. Once word got out that N99 dust masks were needed to keep the harmful particles out of the lungs, they became a common sight.