Operations | Monitoring | ITSM | DevOps | Cloud

Latest Posts

Monitor AWS App Mesh and Envoy with Datadog

Envoy proxies communication among microservices. It is a key component in many service-oriented architectures—and one that offers a unique opportunity to gain visibility into your service mesh. We’re pleased to announce that Datadog integrates with Envoy as well as AWS App Mesh, a new hosted service based on Envoy that dynamically configures your service mesh proxies.

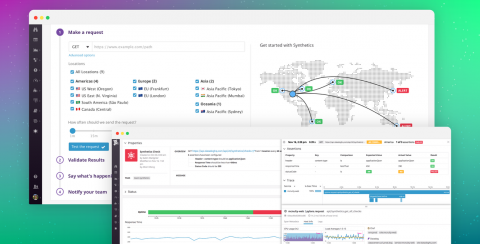
Introducing Datadog Synthetics

Datadog is pleased to announce the upcoming availability of Synthetics, a whole new layer of visibility on the Datadog platform. By monitoring your applications and API endpoints via simulated user requests, Synthetics helps you ensure uptime, identify regional issues, and track application performance. By unifying Synthetics with your metrics, traces, and logs, Datadog allows you to observe how all your systems are performing as experienced by your users.

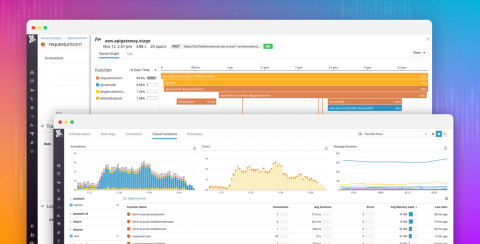
Introducing Datadog for serverless

To make serverless architectures more observable, we’re excited to introduce the new Cloud Functions view in Datadog. You can now search, filter, and explore all your AWS Lambda functions in one central view, and dive straight into detailed performance data that is scoped to a single function. The Cloud Functions view brings together Lambda metrics and logs with distributed request traces from your functions, which are now available in Datadog thanks to our new integration with AWS X-Ray.

Datadog's AWS re:Invent 2018 guide

Each November, AWS re:Invent draws thousands of AWS staff, partners, and users to Las Vegas for an intense week featuring all things AWS and AWS-related. As always, Datadog will be there and we’d love to meet you in person. Our engineers are excited to show off the new features they’ve been building and to answer your monitoring questions!

Monitoring Apache Spark applications running on Amazon EMR

We recently implemented a Spark streaming application, which consumes data from from multiple Kafka topics. The data consumed from Kafka comprises different types of telemetry events generated by mobile devices. We decided to host the Spark cluster using the Amazon EMR service, which manages a fleet of EC2 instances to run our data-processing pipelines.

Introducing the Datadog Cluster Agent

As containers and orchestrators have surged in popularity, they have created highly dynamic environments with rapidly changing workloads—and the need for equally dynamic ways of monitoring them. After all, orchestration technologies like Kubernetes, DC/OS, and Swarm manage container workloads both at the node level and at the cluster level, which means that you need to gather insights from every layer to fully understand the state of your infrastructure.

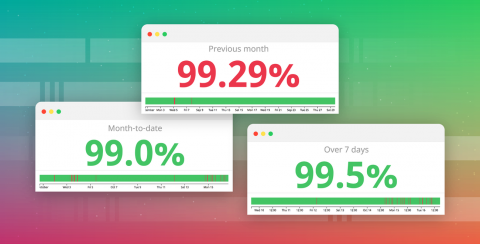
Track the status of your SLOs with the new monitor uptime widget

Service level objectives are an important tool for maintaining application performance, ensuring a consistent customer experience, and setting expectations about service performance for both internal and external users. We are very pleased to announce the availability of a new monitor uptime widget that makes it simple to monitor the status of your SLOs and communicate that status to your teams, executives, or external customers.

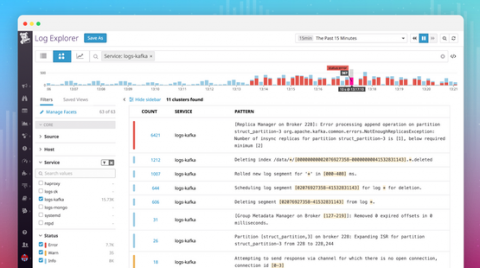
Log Patterns: Automatically cluster your logs for faster investigation

Sifting through all your logs to find what you need can be challenging—especially during an outage, when time is critical and you’re flooded with WARN and ERROR messages. To help you immediately surface useful information from large volumes of logs, we developed Log Patterns.

Pivotal Cloud Foundry Monitoring with Datadog

In part three of this series, we showed you a number of methods and tools for accessing key metrics and logs from a Pivotal Cloud Foundry deployment. Some of these tools help PCF operators monitor the health and performance of the cluster, whereas others allow developers to view metrics, logs, and performance data from their applications running on the cluster.

Collecting Pivotal Cloud Foundry logs and metrics

So far in this series we’ve explored Pivotal Cloud Foundry’s architecture and looked at some of the most important metrics for monitoring each PCF component. In this post, we’ll show you how you can view these metrics, as well as application and system logs, in order to monitor your PCF cluster and the applications running on it.