Operations | Monitoring | ITSM | DevOps | Cloud

Latest Posts

Show it Off with Splunk TV! More Ways to Display Your Best Dashboards

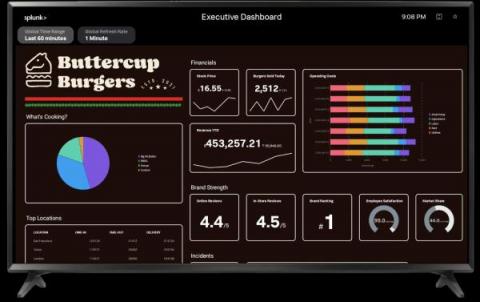
Splunk TV lets you easily display your data on the big screen to visualize and monitor what’s going on in your business. Splunk TV is optimized for a hands-off experience, with slideshows and automatic scrolling so you can display the most important metrics securely and easily. We’re happy to announce that in addition to Classic (Simple XML) dashboards, we now support Studio Dashboards and IT Service Intelligence Glass Tables.

Refined User Experience, New Executive Visibility, and Enhanced Cloud Monitoring with Splunk Enterprise Security 7.0

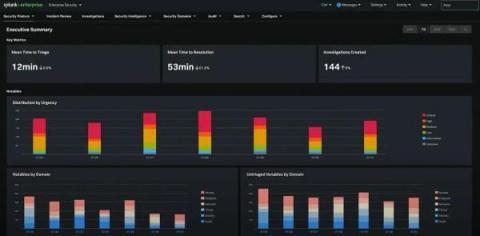
Just like that, another year has gone by full of remote work, virtual conferences, and lengthy Zoom calls. And, although we were not able to see our fellow Splunkers in person at.conf21 that didn’t stop us from previewing the latest enhancements to Splunk Enterprise Security. And now, it gives us great pleasure to announce that Enterprise Security 7.0 is available!

Splunk Enterprise Logs Now Available in Splunk Observability for Simplified Troubleshooting

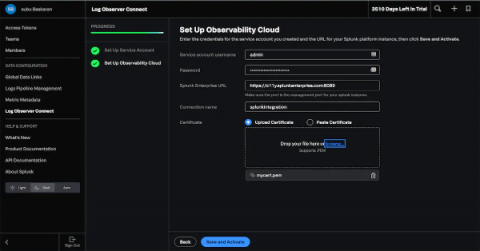
We are excited to announce that Splunk Log Observer Connect for Splunk Enterprise, previewed at.conf21, is now generally available! Log Observer Connect is a new feature that lets observability users explore the data already being sent to existing Splunk instances with Splunk Log Observer’s intuitive no-code interface for faster troubleshooting and root-cause analysis.

Five Trends Driving Australia's Data Landscape in 2022

The last couple years have set new global benchmarks for the data and technology sector, putting companies that have considerably accelerated their digitisation processes in the front row. Our relationship with technology also changed immensely. One that has created new expectations by and for all stakeholders – from consumers to enterprise technology companies and governments.

A New Way to Look Like Splunk

During.conf21, we announced the public release of the Splunk UI Toolkit, a collection of packages and libraries that provides some of the same underlying tools powering our product line to you, the Splunk developer. Now, any Splunk developer can incorporate Splunk UI components into their own custom applications and tools. This includes everything from buttons and inputs from our @splunk/react-ui package, or our new parallel coordinates visualization from our @splunk/visualizations package.

Splunk RUM Frontend Error Monitoring is Now Generally Available!

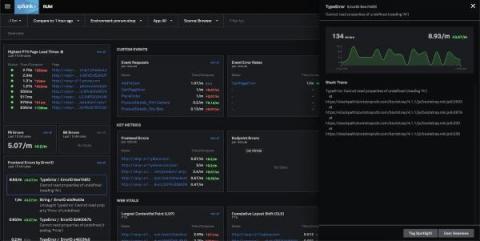
Debugging errors is an essential component to SRE and developer workflows. “How do we prioritize and isolate JavaScript errors more effectively?” is a top challenge we hear from engineering teams looking to improve end-user experience. Therefore, we are excited to announce the general availability of Splunk RUM frontend error monitoring.

Five Critical Insights You Won't Get With Your Cloud Provider's Monitoring Solution Alone

When meeting with a current or prospective Splunk customer, one question we are often asked is “Why do I need Splunk when I can just use AWS Cloudwatch, Azure Monitor, or GCP Cloud Operations Suite (formerly known as Stackdriver) for my cloud monitoring needs?” And what a great question it is!

Splunk Mobile, iPad, AR and TV in Private Networks

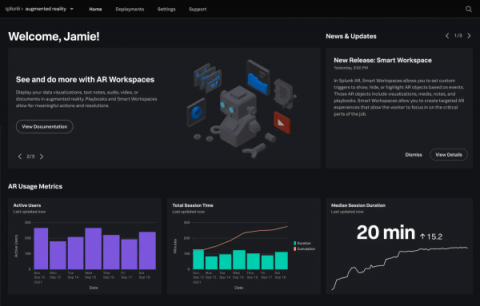
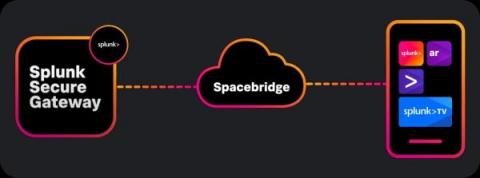
Having Splunk Mobile available in your pocket is great, but what if you're not able to take advantage of it because of Defense Federal Acquisition Regulation Supplement (DFARS) requirements or security concerns? Through this blog post, you'll learn how deploying a Private Spacebridge might be the right answer!