Operations | Monitoring | ITSM | DevOps | Cloud

Latest Posts

Introducing the Netdata demo space

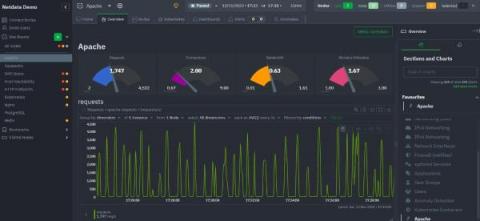
Introducing Netdata's Demo Space, a quick and easy way to experience monitoring environments before you set them up yourself. At Netdata, we are always striving to provide the best monitoring experience for our users. We understand that adopting a new monitoring solution can sometimes be challenging, especially when you're unsure of how it will fit your specific environment. That's why we're excited to announce the Netdata Demo Space!

Google Colab Monitoring with Netdata

Hello, fellow data enthusiasts and Google Colab aficionados! Today, we're going to explore how to monitor your Google Colab instances using Netdata. Colab is a fantastic platform for running Notebooks, developing ML models, and other data science and analytics tasks. But have you ever wondered how your Colab instance is performing under the hood? That's where Netdata comes into play!

Windows Server Monitoring Improvements

Monitor your Windows server and applications running on it with Netdata - simple, powerful and free. Hey Netdata community, We have some exciting news for you: we’re launching our new and updated Windows collectors with the goal of making the Windows monitoring experience as seamless as possible 🎉 We know that Windows monitoring has been a long time ask from many of you, and we’ve been working hard to make it easier than ever to monitor your Windows metrics with Netdata.

Anomaly detection on Prometheus metrics

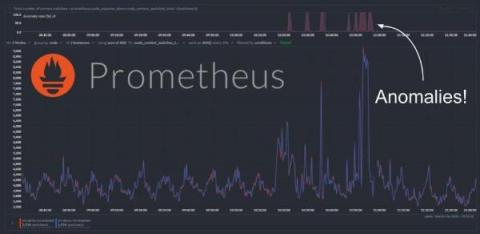
We have recently extended the native machine learning (ML) based anomaly detection capabilities of Netdata to support all metrics, regardless on their collection frequency (update every). Previously only metrics collected every second were supported, but now Netdata can run anomaly detection out of the box with zero config on metrics with any collection frequency.

Monitor any SQL metrics with Netdata (and Pandas )

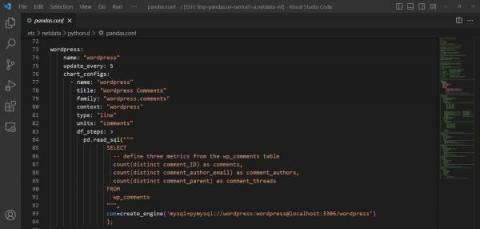
We recently got this great feedback from a dear user in our Discord: This is great and exactly what we want, a clear problem or improvement we could make to help make that users monitoring life a little easier. This is also where the beauty of open source comes in and being able to build on the shoulders of giants - adding such a feature turned out to be pretty easy by just extending our existing Pandas collector to support SQL queries leveraging its read_sql() capabilities.

Introducing Netdata Paid Subscriptions

Read more about Netdata introducing paid subscriptions. All Netdata functionality is and will be available for free forever in the Community Plan. Paid tiers include features targeted for businesses and users who would need to customise their monitoring solution with different levels of user access, other notification mechanisms, etc.

Release 1.38.0: Dramatic performance and stability improvements, with a smaller agent footprint

We completely reworked our custom-made, time series database (dbengine), resulting in stunning improvements to performance, scalability, and stability, while at the same time significantly reducing the agent memory requirements. On production-grade hardware (e.g. 48 threads, 32GB ram) Netdata Agent Parents can easily collect 2 million points/second while servicing data queries for 10 million points / second, and running ML training and Health querying 1 million points / second each!

Extending Netdata's anomaly detection training window

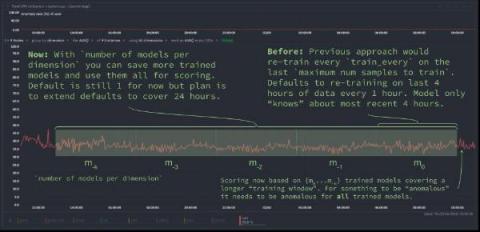
We have been busy at work under the hood of the Netdata agent to introduce new capabilities that let you extend the "training window" used by Netdata's native anomaly detection capabilities. This blog post will discuss one of these improvements to help you reduce "false positives" by essentially extending the training window by using the new (beautifully named) number of models per dimension configuration parameter.