Operations | Monitoring | ITSM | DevOps | Cloud

Latest Posts

Grafana 11.4 release: Introducing support for OpenSearch PPL and OpenSearch SQL in the AWS CloudWatch data source plugin

Holidays came early for AWS users: Grafana 11.4 introduces support for two new query languages in the AWS CloudWatch data source plugin. Grafana 11.4: Download now Announced during AWS re:Invent, AWS CloudWatch Logs expanded its querying capabilities with the addition of OpenSearch Piped Processing Language (PPL) and OpenSearch SQL. In Grafana 11.4, the AWS Cloudwatch data source plugin has been updated to offer the same functionality — and the same flexibility.

Grafana Alerting: Save time and effort with Grafana-managed recording rules

Grafana Alerting has seen steady growth and adoption since it was revamped in Grafana 9. Since then, we’ve been busy making your alerts more robust, more reliable, and easier to manage. As part of that process, Grafana Alerting has adopted several concepts from Prometheus. The Prometheus alerting model is well understood and flexible, and with Grafana Alerting we want to bring that same flexibility to all Grafana data sources.

The evolution of Grafana Cloud Synthetic Monitoring: new features, pricing updates, and more

With 2024 coming to a close, it’s a good time to reflect on how Grafana Cloud has evolved this year — and synthetic monitoring, in particular, is one area where we’ve really focused our efforts. In May, we rolled out a revamped version of Grafana Cloud Synthetic Monitoring with the overall goal of making your monitoring processes not just more efficient, but more impactful.

How to query private network data without an agent using AWS and Grafana Cloud

Connecting to data sources in a private network or an Amazon Virtual Private Cloud (Amazon VPC) can require extra attention to the network security configuration to prevent unintended network exposure. For example, if you wanted to query a network-secured data source, like a MySQL database or an Elasticsearch cluster, that is hosted in an on-premises private network, you would need to open your network to inbound queries from a range of IP addresses.

Exploring OpenTelemetry Collector configurations in Grafana Cloud: a tasting menu approach

I’m a big fan of tasting menus. In the culinary world they let us sample a variety of dishes in small portions, helping us understand and appreciate different flavors and options. Inspired by this concept and a talk I gave earlier this year, I have crafted a “tasting menu” of OpenTelemetry Collector configurations in Grafana Cloud.

Why companies choose Grafana Cloud over self-hosted OSS stacks

While we all love open source technology and the community that comes with it, we don’t always have the time or resources to stand up, maintain, update, and troubleshoot a self-hosted OSS stack. This is one of the (many) reasons companies choose to implement Grafana Cloud: you get all the goodness of the open source Grafana LGTM Stack (Loki for logs, Grafana for visualization, Tempo for traces, Mimir for metrics) in a fully managed, end-to-end observability platform.

How to use OpenTelemetry and Grafana Alloy to convert delta to cumulative at scale

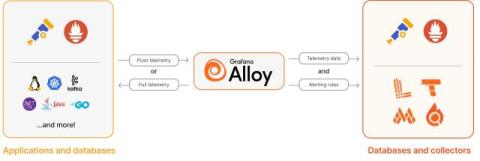
Migrating from other vendors becomes a lot easier with OpenTelemetry and Grafana Alloy, our distribution of the OpenTelemetry Collector. But when you come from platforms that use different temporalities, such as Datadog or Dynatrace, you face a challenge integrating with a Prometheus-like ecosystem such as Grafana Cloud: Your metrics still mean the same as before, but they just don’t look right.

Leveraging OpenTelemetry and Grafana for observing, visualizing, and monitoring Kubernetes applications

Ken has over 15 years of industry experience as a noted information and cybersecurity practitioner, software developer, author, and presenter, focusing on endpoint security, big security data analytics, and Federal Information Security Management Act (FISMA) and NIST 800-53 compliance. Focusing on strict federal standards, Ken has consulted with numerous federal organizations, including Defense Information Systems Agency (DISA), Department of Veterans Affairs, and the Census Bureau.

Grafana Loki 3.3 release: faster query results via Blooms for structured metadata

The Grafana Loki 3.3 release is here, and it brings a fresh wave of enhancements aimed at making your log management experience faster, more efficient, and more scalable. While this update includes the usual round of bug fixes and operational improvements, the standout feature is a shift in how Loki leverages Bloom filters—going from free-text search to harnessing the power of structured metadata.

5 tips to write better browser tests for performance testing and synthetic monitoring

Given the complexity of modern websites, browser testing is essential to ensure a positive user experience. With the Grafana k6 browser module, you can interact with real web browsers and simulate user interactions — like clicking, typing, or navigating pages — to collect frontend metrics, increase site reliability, and fix performance issues before they ever impact your users.