Operations | Monitoring | ITSM | DevOps | Cloud
Latest Posts
Making design decisions for ClickHouse as a core storage backend in Jaeger
ClickHouse database has been used as a remote storage server for Jaeger traces for quite some time, thanks to a gRPC storage plugin built by the community. Lately, we have decided to make ClickHouse one of the core storage backends for Jaeger, besides Cassandra and Elasticsearch. The first step for this integration was figuring out an optimal schema design. Also, since ClickHouse is designed for batch inserts, we also needed to consider how to support that in Jaeger.
Experiment: Migrating OpenTracing-based application in Go to use the OpenTelemetry SDK
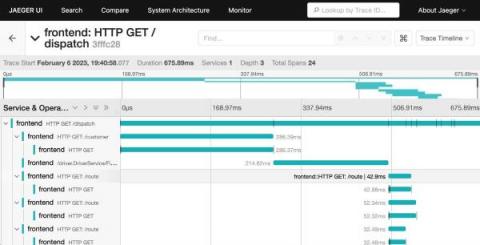
Jaeger’s HotROD demo has been around for a few years. It was written with OpenTracing-based instrumentation, including a couple of OSS libraries for HTTP and gRPC middleware, and used Jaeger’s native SDK for Go, jaeger-client-go. The latter was deprecated in 2022, so we had a choice to either convert all of the HotROD app’s instrumentation to OpenTelemetry, or try the OpenTracing-bridge, which is a required part of every OpenTelemetry API / SDK.
Better alignment with OpenTelemetry by focusing on OTLP
TL;DR: proposal (and a survey) to deprecate native Jaeger exporters in OpenTelemetry SDKs in favor of OTLP exporters.
Introducing native support for OpenTelemetry in Jaeger
The latest Jaeger v1.35 release introduced the ability to receive OpenTelemetry trace data via the OpenTelemetry Protocol (OTLP), which all OpenTelemetry SDKs are required to support. This is a follow-up to the previous announcement to retire Jaeger’s “classic” client libraries. With this new capability, it is no longer necessary to use the Jaeger exporters with the OpenTelemetry SDKs, or to run the OpenTelemetry Collector in front of the Jaeger backend.
Jaeger Tracing: A Friendly Guide for Beginners
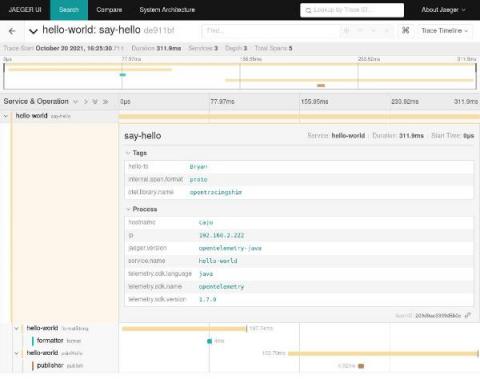
Written by @thetomzach @ Aspecto. In this guide, you’ll learn what Jaeger tracing is, what distributed tracing is, and how to set it up in your system. We’ll go over Jaeger’s UI and touch on advanced concepts such as sampling and deploying in production. You’ll leave this guide knowing how to create spans with OpenTelemetry and send them to Jaeger tracing for visualization. All that, from scratch.
Adaptive Sampling in Jaeger
In distributed tracing, sampling is frequently used to reduce the number of traces that are collected and stored in the backend. This is often desirable because it is easy to produce more data than can be efficiently stored and queried. Sampling allows us to store only a subset of the total traces produced.
Migrating from Jaeger client to OpenTelemetry SDK
A couple of years ago, the OpenTelemetry project was founded by the merger of two similarly aimed projects: OpenTracing and OpenCensus. One of the goals of this new project was to create an initial version that would “just work” with existing applications instrumented using OpenTracing and OpenCensus.
Jaeger Persistent Storage With Elasticsearch, Cassandra & Kafka
Running systems in production involves requirements for high availability, resilience and recovery from failure. When running cloud native applications this becomes even more critical, as the base assumption in such environments is that compute nodes will suffer outages, Kubernetes nodes will go down and microservices instances are likely to fail, yet the service is expected to remain up and running.
A 5 Minute Guide for Experimenting with Ambassador and Jaeger in a Kubernetes Sandbox
Implementing distributed tracing is fast becoming a fundamental expectation when building modern (distributed) systems. However, this is yet another thing for developers to learn, and configuring distributed tracing on Kubernetes is hard, right? Actually, no. Getting started with Jaeger on Kubernetes has never been easier.


